The AI Traffic Decade: What Nokia’s 2026 Global Network Traffic Report Gets Right, and Where the Network Bill Actually Lands

Every few years a vendor publishes a traffic forecast that becomes the industry’s reference number. For most of the last two decades that was Cisco’s VNI. Nokia’s Global Network Traffic Report 2026 is a serious attempt to take that seat for the AI era, and it earns the attention: 46 pages, a bottom-up model across eight regions, three demand scenarios, lab-measured uplink/downlink profiles for real AI applications, and, most usefully, a reference architecture that follows AI traffic across twelve network links instead of stopping at the access edge.
The headline is simple. Global traffic nearly quadruples to 3,789 EB/month by 2035, and 44% of it is driven by AI. But the headline is the least interesting part. The interesting parts are what happens to that traffic after it enters the network, where it gets served, which direction it flows, and what that does to the economics of carrier routing, RAN and edge compute. That is where ACG spends most of this piece.
I will walk through the report’s numbers, then layer on our own analysis in four areas: routing and transport, the cellular uplink, the “AI grid” and its economics, and a sanity check on the methodology. I will tell you where we agree, where we would push back, and what we think operators, equipment vendors and cloud providers should actually do with this.
1. The big numbers
Nokia’s moderate scenario puts 2035 global traffic at 3,789 EB/month, roughly 4x 2026. The split: 2,108 EB/month of non-AI traffic (12% CAGR), 694 EB/month of “AI-influenced” traffic (17% CAGR) and 987 EB/month of AI-native traffic (58% CAGR, about 60x 2026 levels).
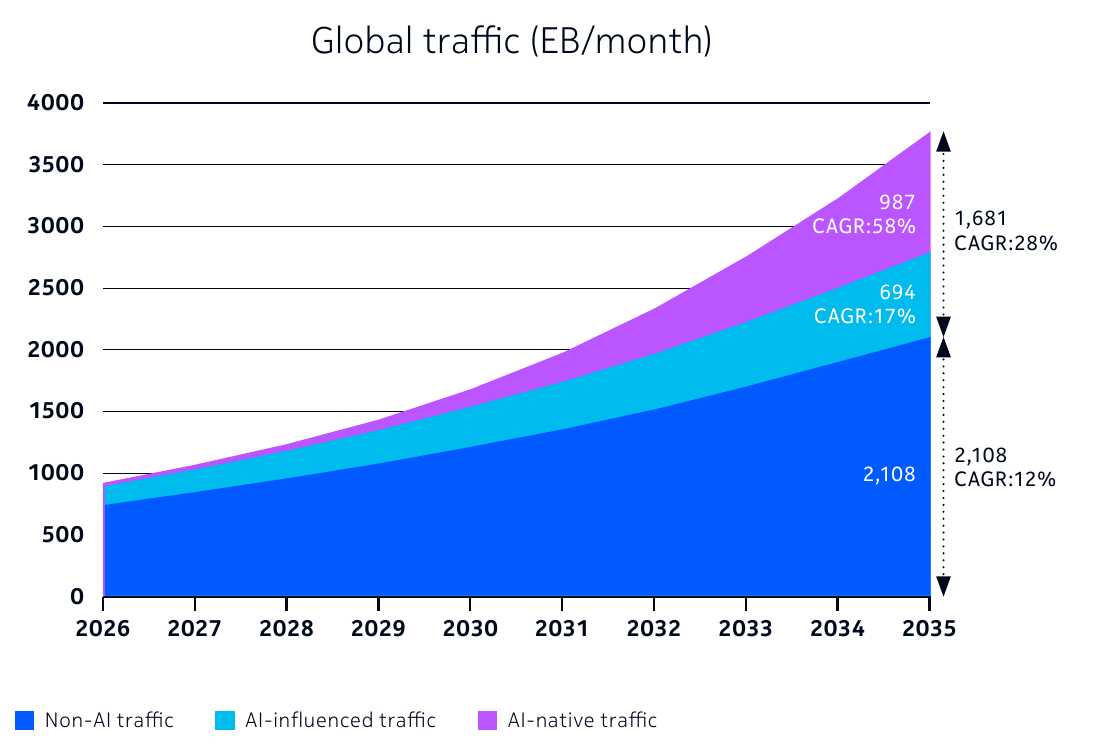
Source: Nokia Global Network Traffic Report 2026, p.11.
Inside AI-native traffic, the composition matters more than the total. Consumer access AI reaches 181 EB/month (42% CAGR), enterprise access AI reaches 258 EB/month (59% CAGR), and the single largest bucket, 548 EB/month, is cloud AI traffic: the exchanges between models, agents, tools and data sources that fire off behind a user request and that the end user never sees.
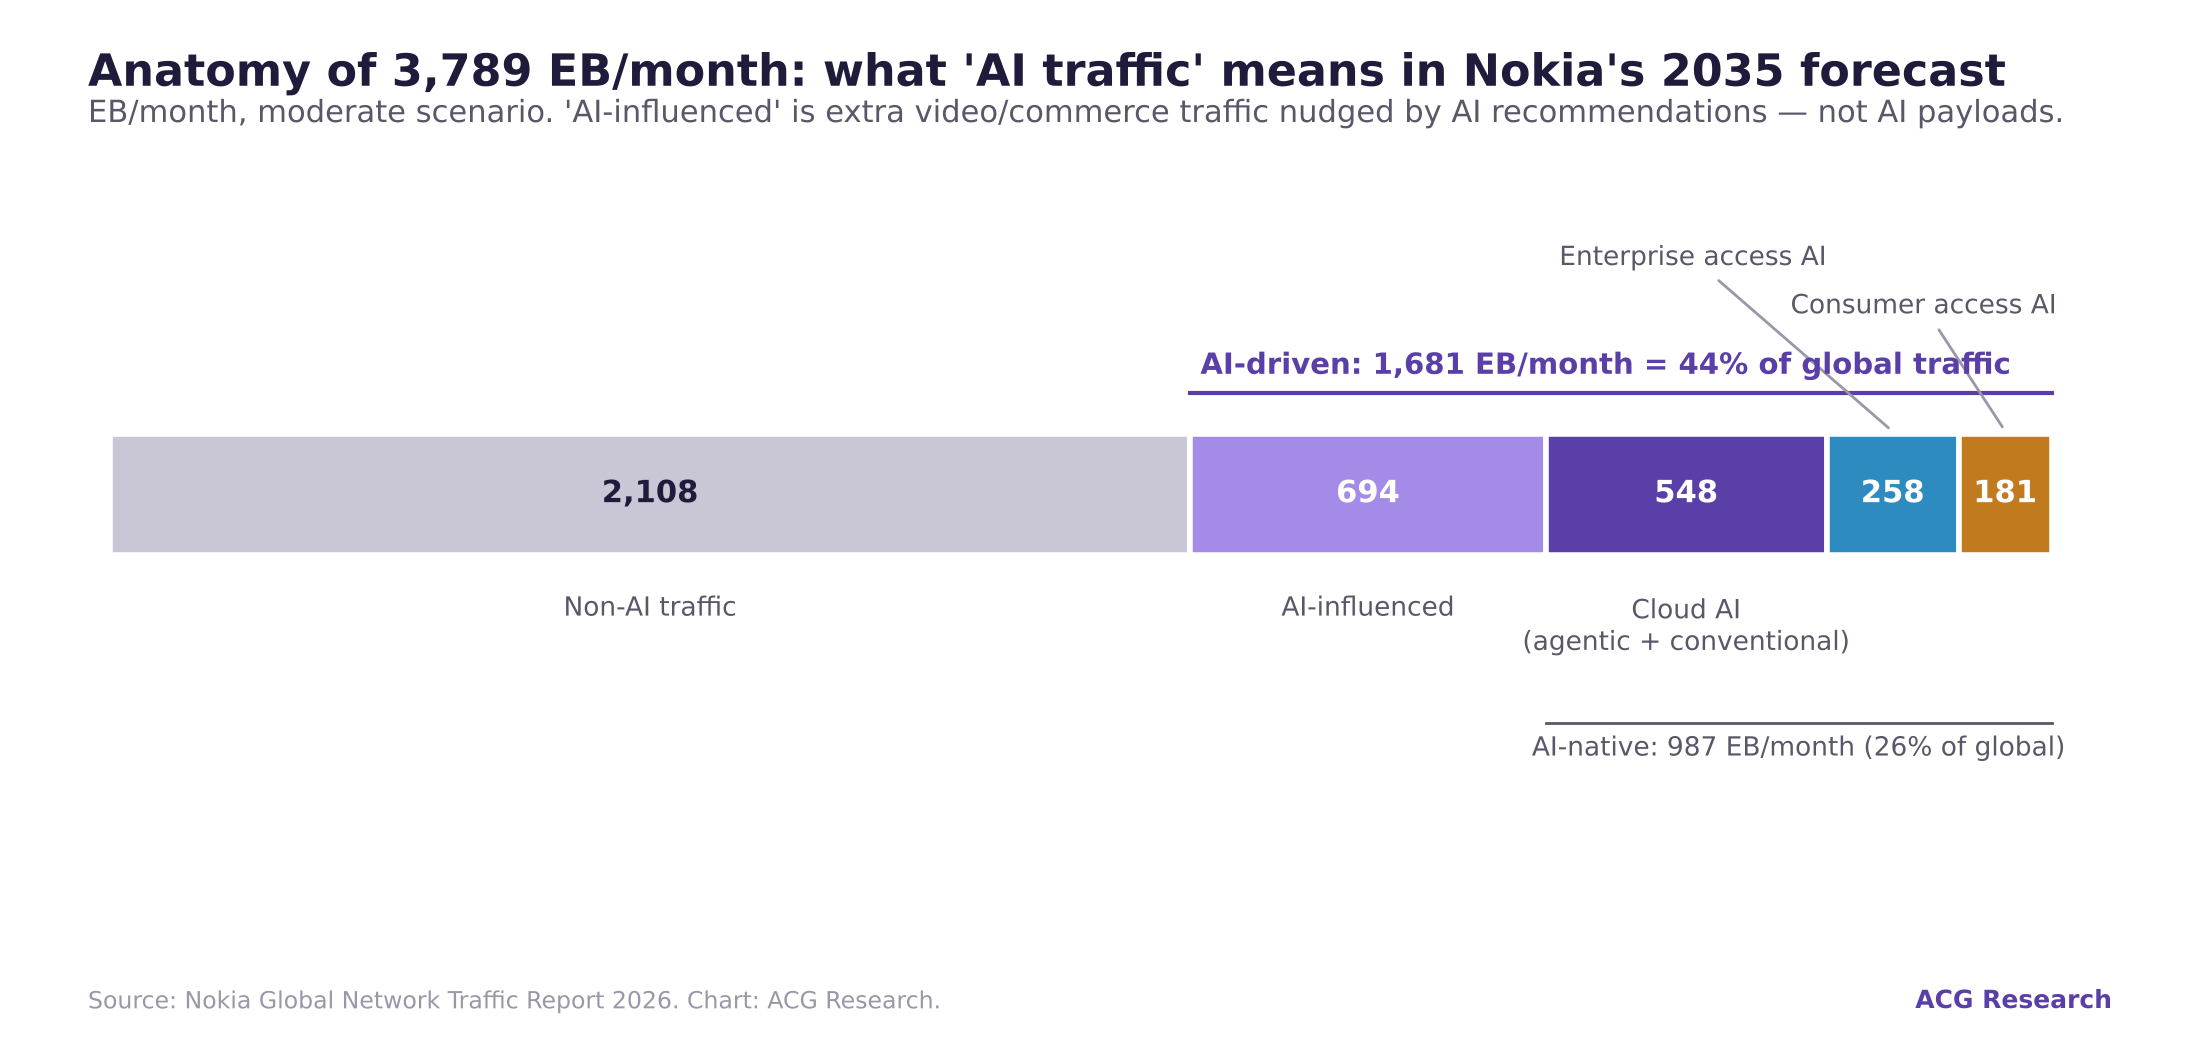
Two things jump out of that anatomy chart.
First, more than half of AI-native traffic (548 of 987 EB/month) never touches a consumer or enterprise access line at all. It is machine-to-machine traffic inside and between clouds. That has very different implications for who builds capacity and who pays for it than consumer-facing AI does.
Second, the “44% of traffic is AI” headline depends on the 694 EB/month of AI-influenced traffic, which Nokia defines as incremental video and commerce traffic that AI recommendations nudged people into consuming. Strip that out and AI-native traffic is 26% of the 2035 total. Both numbers are defensible; they just answer different questions. We will come back to this in the methodology section.
The growth ladder
The report is really a story about compounding rates. The network baseline is 15% CAGR for global access traffic. Every AI category sits well above it.
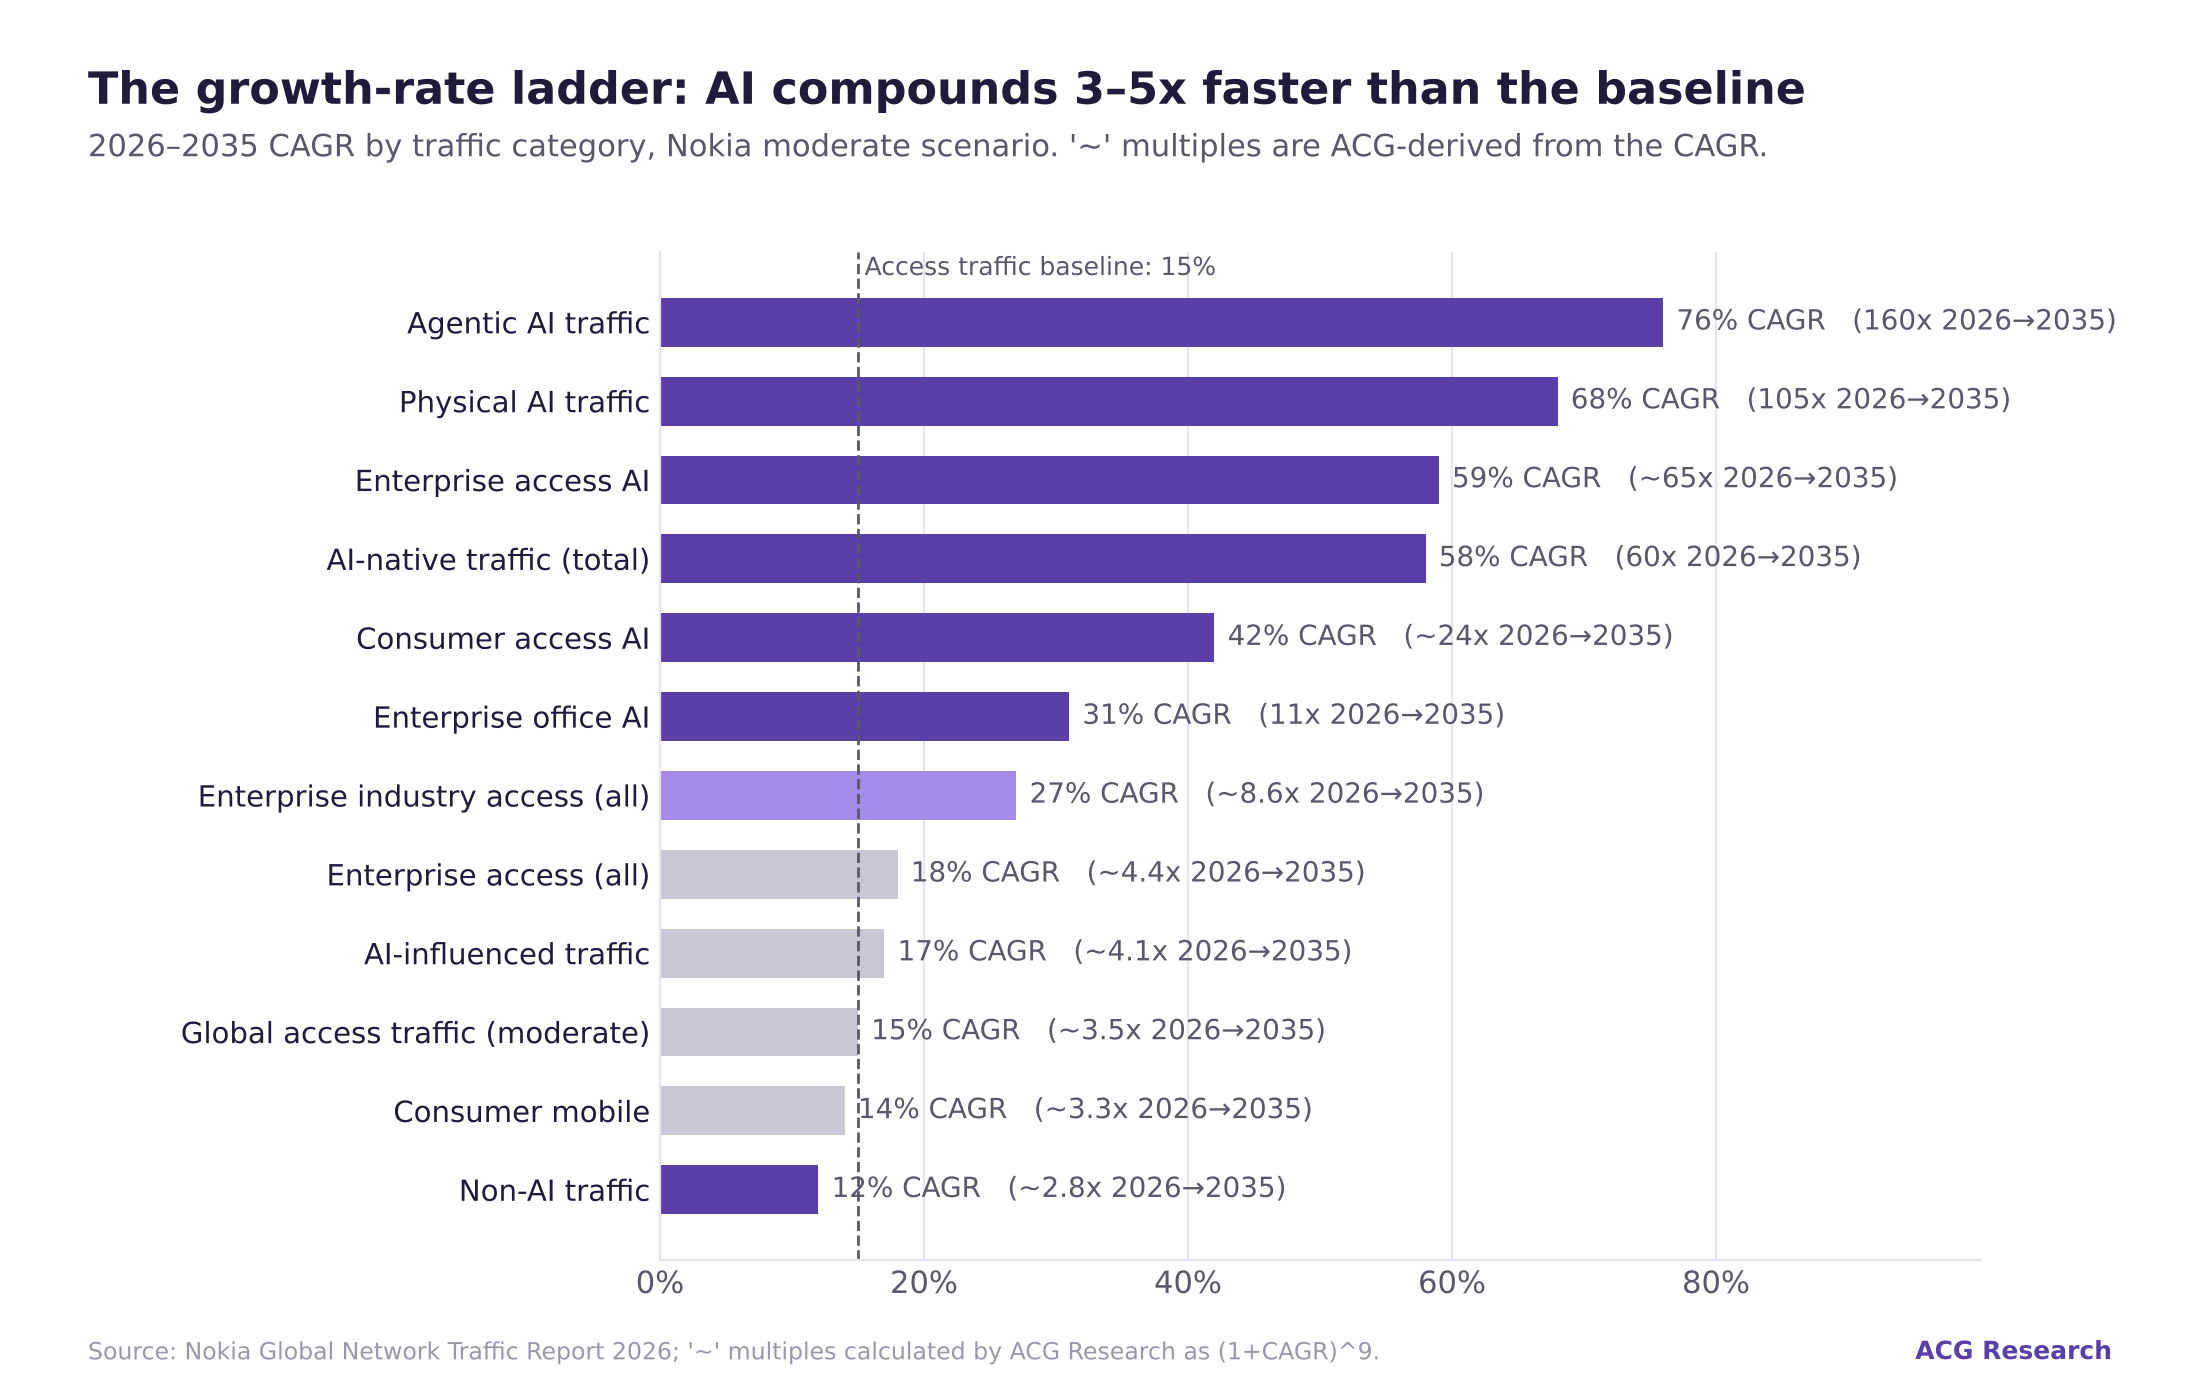
Agentic AI traffic grows at 76% CAGR to 585 EB/month (160x), physical AI at 68% to roughly 67 EB/month (105x), enterprise access AI at 59%, and consumer access AI at 42%. Even enterprise office AI, the copilots and coding assistants, grows 11x at 31% CAGR, three times faster than non-AI office workloads.
One ACG calculation worth holding onto: working backwards from Nokia’s CAGRs, 2026 traffic is roughly 945 EB/month, of which about 760 is non-AI, 169 is AI-influenced and only about 16 is AI-native. That means over the decade non-AI traffic adds about 1,350 EB/month while AI-driven traffic (native plus influenced) adds about 1,500. In other words, Nokia’s model says AI is a slim majority of incremental traffic over the decade, but video is still a very large fraction of the capacity you build. Anyone planning a network as if conventional traffic has stopped growing will be wrong.
2. AI traffic behaves differently, and the direction matters more than the volume
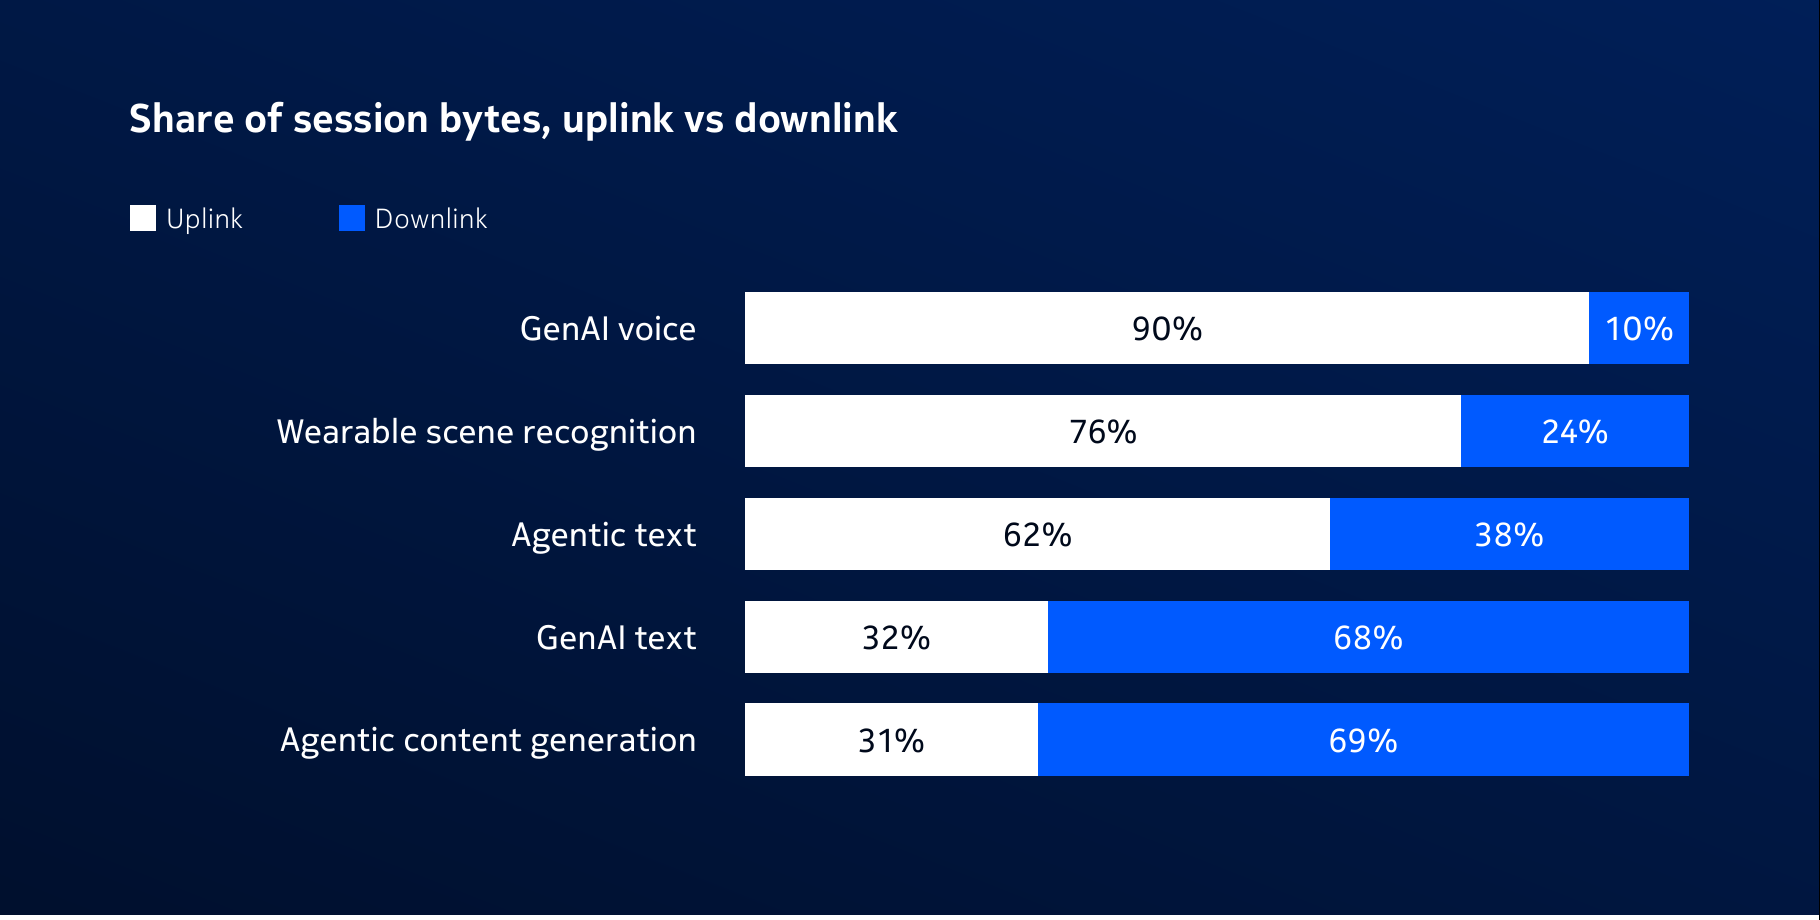
The part of the report that will age best is the lab work on traffic behavior. Nokia measured session byte profiles for five AI application types and published the uplink/downlink splits.
Source: Nokia Global Network Traffic Report 2026, p.15.
GenAI voice is 90% uplink. Wearable scene recognition (smart glasses streaming camera frames to the cloud) is 76% uplink. Agentic text is 62% uplink. Only text chat and agentic content generation look like the downlink-heavy web we built networks for, at 32% and 31% uplink respectively.
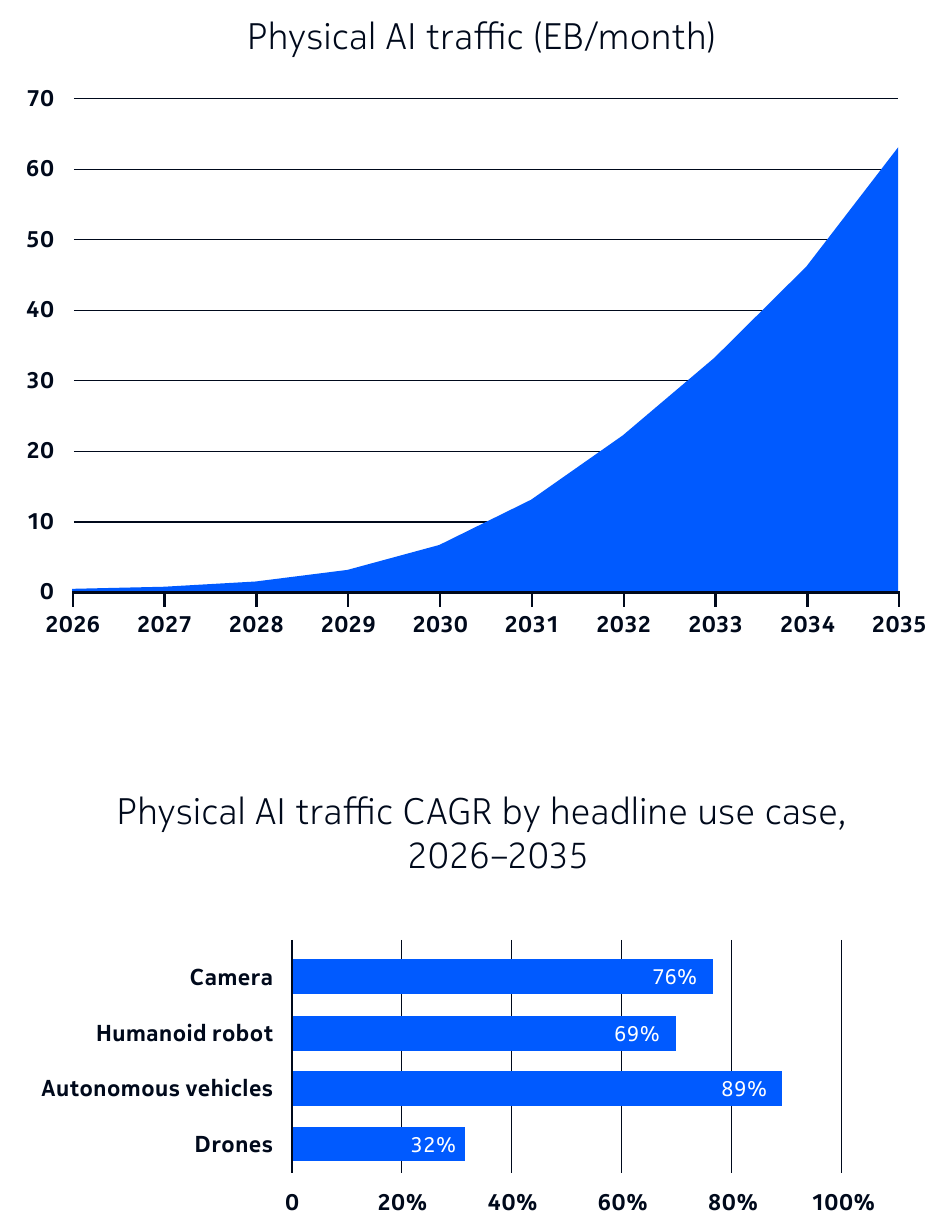
Layer physical AI on top of that and the picture is stark: Nokia projects more than 90% of physical AI traffic will be uplink. A docked drone, a robotaxi fleet or a PTZ camera array sends video, 3D scans, telemetry and incident footage up and receives little more than a route, a command and an occasional model update down.
Source: Nokia Global Network Traffic Report 2026, p.21.
The physical AI installed-base assumptions behind this are bullish. Nokia models 1.7 billion cameras, 17.1 million humanoid robots, 6.8 million commercial drones and 2.5 million robotaxis by 2035, with autonomous vehicles the fastest growing traffic source at 89% CAGR and cameras the largest in absolute volume at 76%. We will flag the humanoid number in the methodology section, but even at half those volumes the directional conclusion holds: a new class of always-connected, uplink-dominant endpoints is arriving, and no access network was engineered for it.
Agentic AI: the traffic you don’t see
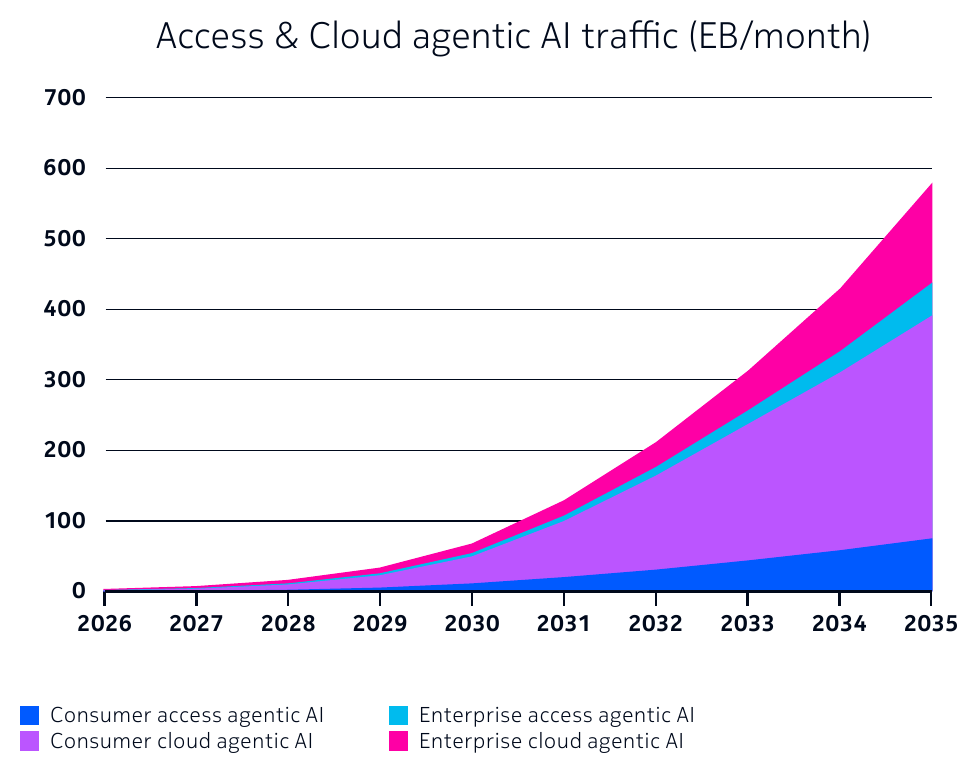
The agentic chapter is the most novel piece of modeling in the report. Nokia defines an orchestration workflow (planning agent, task execution agents, QA agent, knowledge sources, external services) and counts each exchange once across links A through E. The result is 585 EB/month of agentic traffic by 2035, of which 462 EB/month is cloud-side orchestration and only 123 EB/month crosses an access network.
Source: Nokia Global Network Traffic Report 2026, p.18.
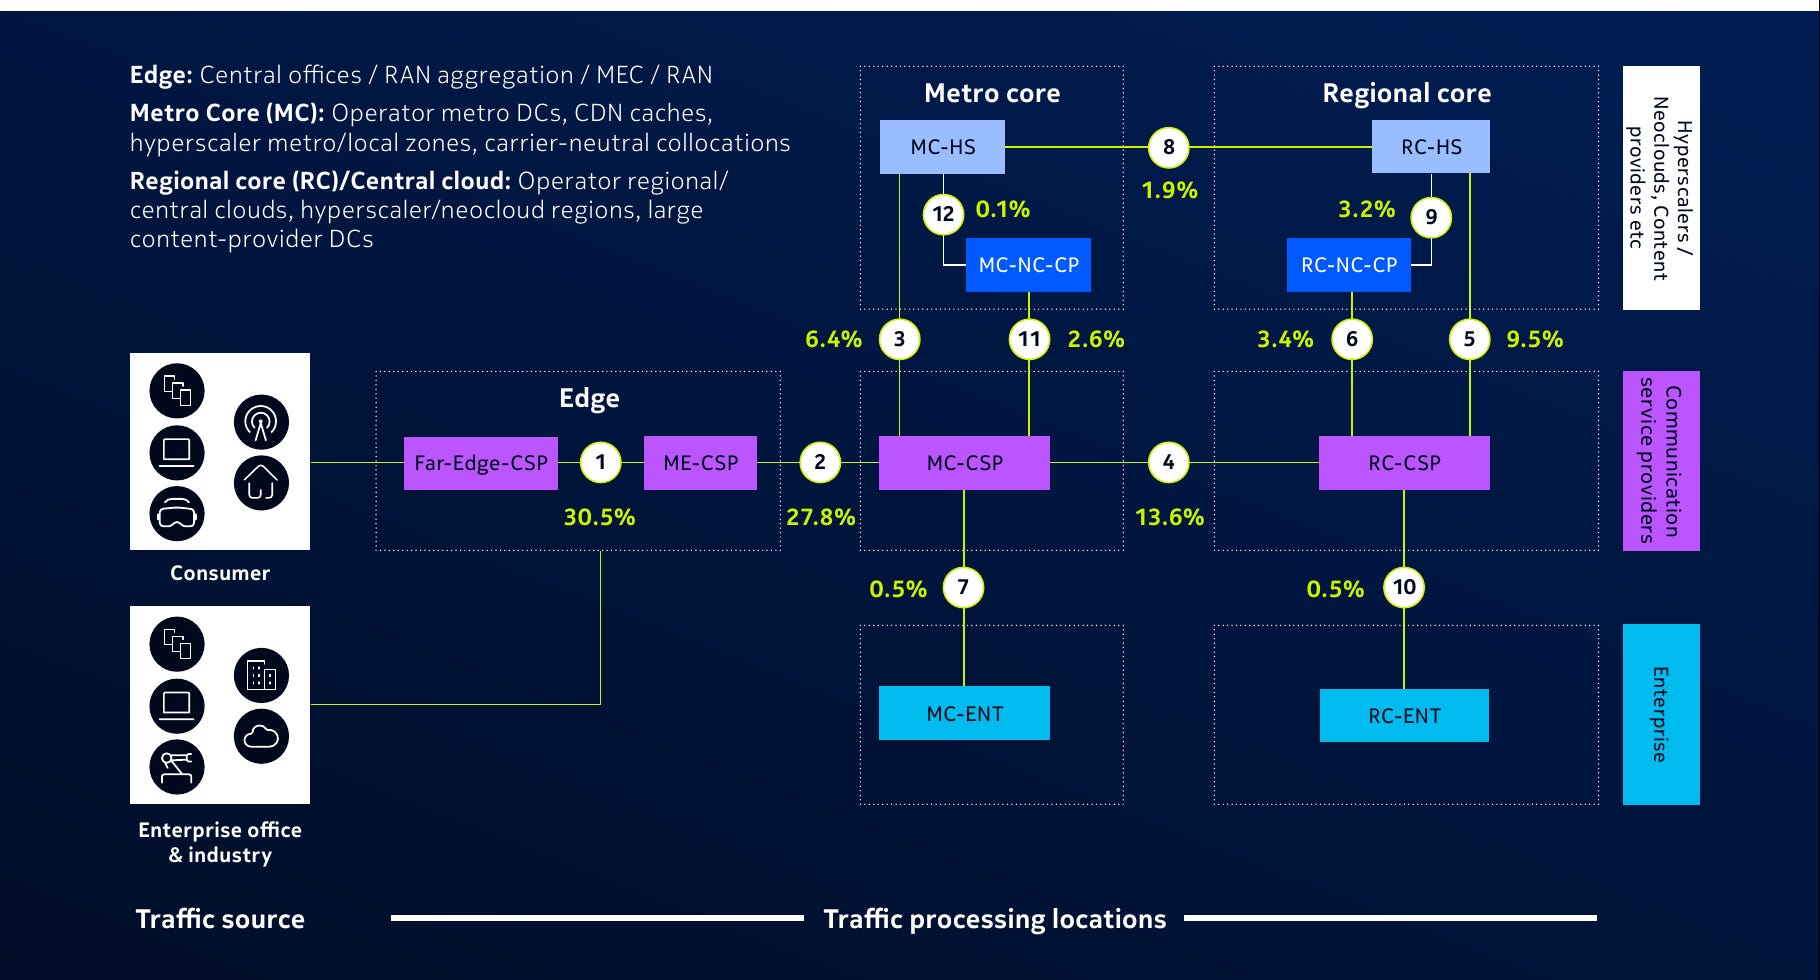
Read that again: roughly 80% of agentic traffic is east-west between cloud services. It is generated inside hyperscaler regions, neoclouds, metro zones and the interconnects between them. That is a data center interconnect and peering story at least as much as an access story, and it is why we think the single most important chart in the report is not a traffic chart at all. It is the reference architecture.
3. Where the traffic actually lands: the routing and transport view
This is the section I would hand to anyone who sells, buys or plans carrier routing.
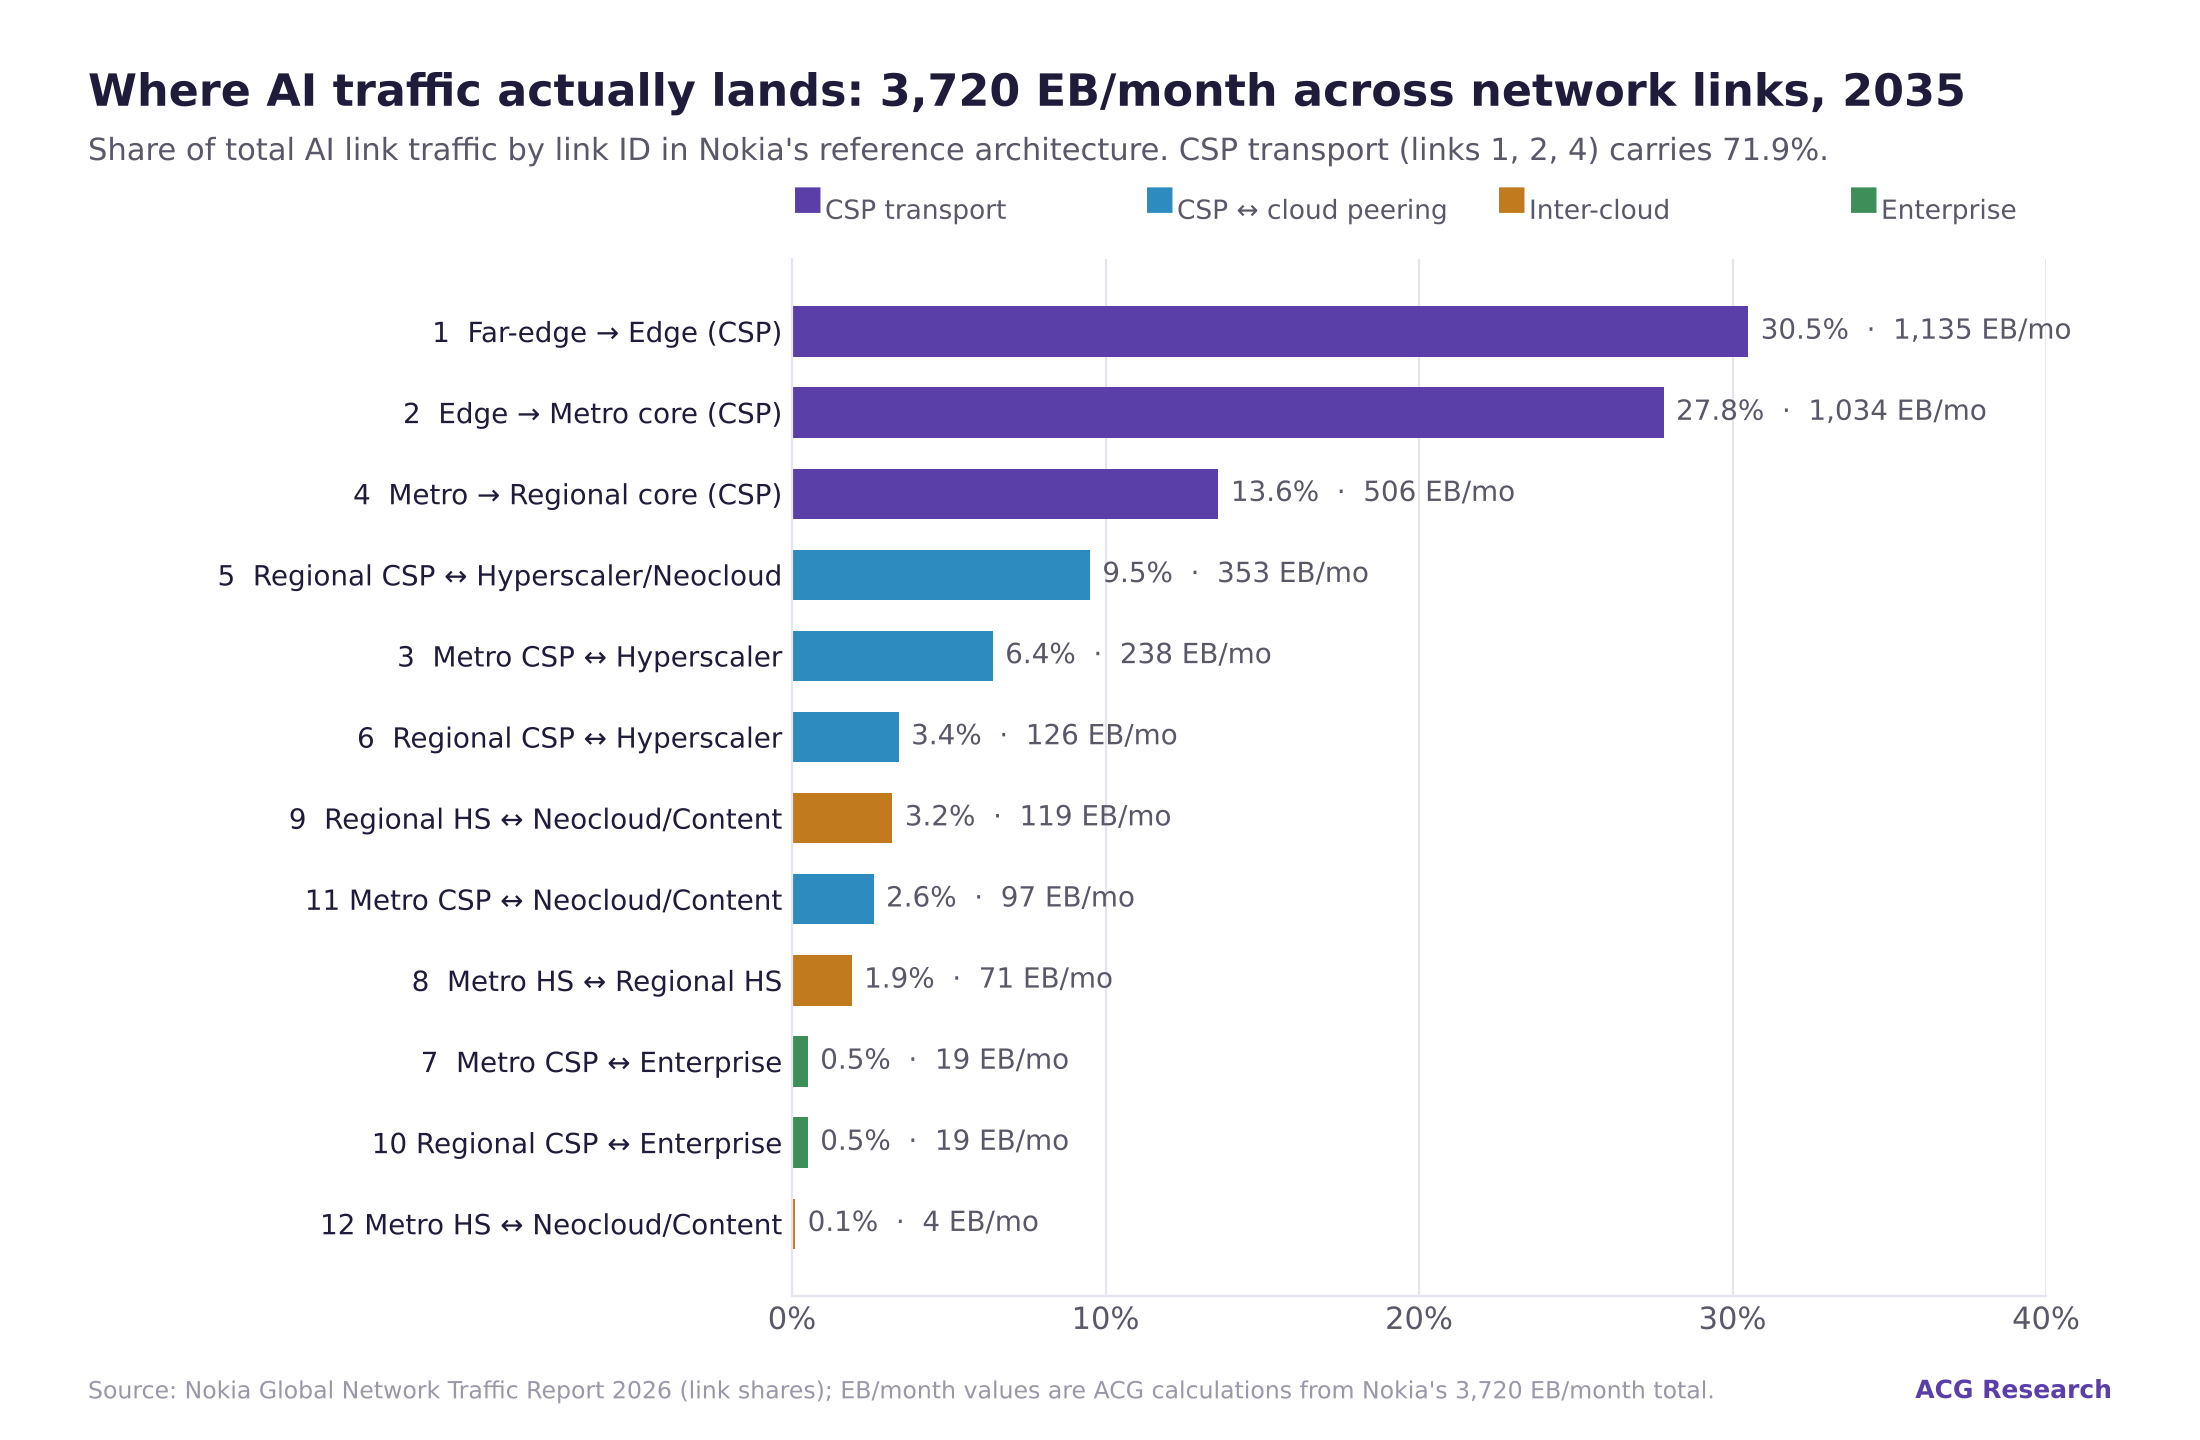
Nokia models 1,134 EB/month of AI traffic (access AI plus AI-influenced) crossing the access boundary in 2035. Once inside the network that traffic traverses multiple links between tiers and providers, and the access AI portion triggers additional cloud AI exchanges. Counting every link crossed, the network carries 3,720 EB/month of AI traffic, a 3.3x amplification. More than 70% of that rides on CSP transport links.
Source: Nokia Global Network Traffic Report 2026, p.24. Links 1, 2 and 4 are CSP transport.
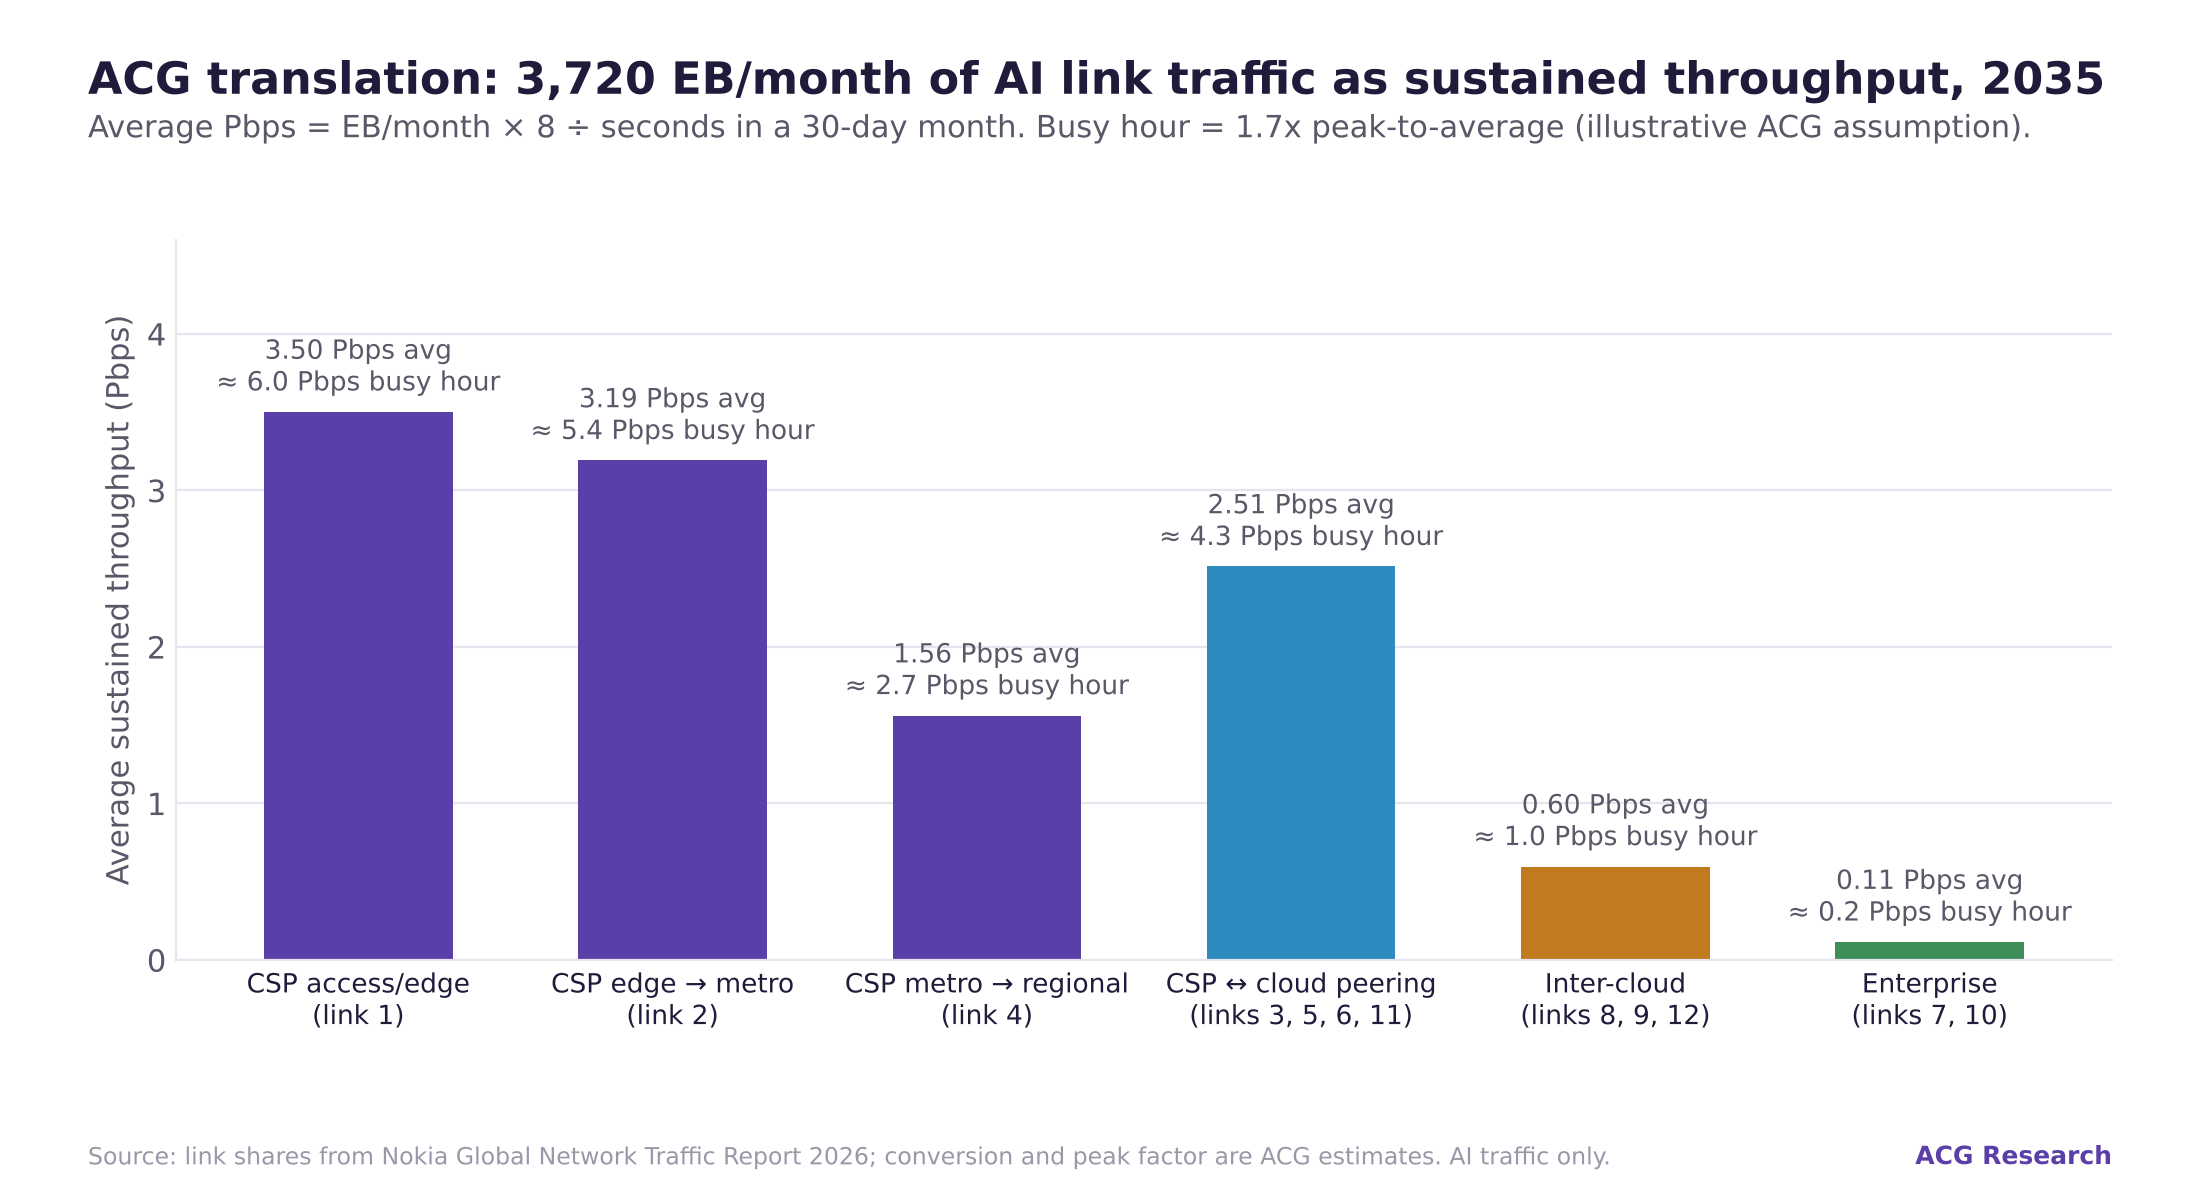
We took Nokia’s published link shares and converted them into EB/month and into sustained throughput so the numbers mean something to a routing planner.
ACG’s read of the routing implications:
The load concentrates in metro aggregation, not the core. Links 1 (far-edge to edge) and 2 (edge to metro core) carry 58% of all AI link traffic, roughly 2,170 EB/month between them, or about 6.7 Pbps of sustained average throughput on AI alone. Link 4 (metro to regional core) carries 13.6%. That inverts the traditional capacity pyramid in which the core is the fat pipe and aggregation is the thin, cost-optimized layer. The cell site router, the aggregation router and the metro core router are where AI traffic growth hits first and hardest. For the Carrier Routing & Switching market that ACG tracks, this argues for a sustained metro refresh cycle: 400GE at the aggregation layer becoming table stakes, 800GE and coherent pluggable optics (400ZR/ZR+, 800ZR) moving from the core into metro rings, and 1.6T emerging in the regional core toward the end of the period.
Peering and cloud on-ramps become a first-class capacity problem. Links 3, 5, 6 and 11, the CSP-to-hyperscaler and CSP-to-neocloud/content handoffs, carry 21.9% of AI link traffic, about 815 EB/month or 2.5 Pbps average. Today peering capacity is often negotiated reactively. In an agentic world where a single user request fans out into dozens of service-to-service calls, some of which cross provider boundaries, the on-ramp becomes a latency and cost bottleneck. We expect to see more operator metro DC and carrier-neutral colocation investment specifically to shorten these paths.
Symmetry becomes a design input. Routing platforms are not inherently asymmetric, but the access and aggregation networks feeding them are: PON splits, FWA, TDD mid-band. When 90% of physical AI traffic is uplink, the aggregation router sees a fundamentally different ingress profile from its access-facing ports. Buffer sizing, QoS hierarchies, and the balance of access-facing versus uplink-facing port capacity on aggregation platforms all need rethinking.
Burst, not average, sizes the ports. The report’s own traffic traces show agentic sessions that rarely idle and wearables that sit silent then dump coalesced image frames. Our busy-hour figures in the throughput chart apply a conventional 1.7x peak-to-average factor, but AI-dense locations with synchronized machine behavior will exceed that. Planners should expect to over-provision aggregation more than they would for video.
What the forecast excludes matters for the routing market. Nokia explicitly leaves out training data transfers between data centers, token traffic on scale-up/scale-out/scale-across fabrics, and inter-DC replication and backup. That is the correct scoping decision for a WAN traffic report, but it means the report says nothing about the data center fabric and DCI spend that has dominated routing and switching revenue growth in 2024 through 2026. Readers should not use this forecast to size the AI back-end network market; it is strictly a view of the service provider WAN and the cloud workflows it triggers.
4. The cellular uplink: an average that hides a crisis
The uplink chapters are the strongest section of the report because they refuse to hide behind averages.
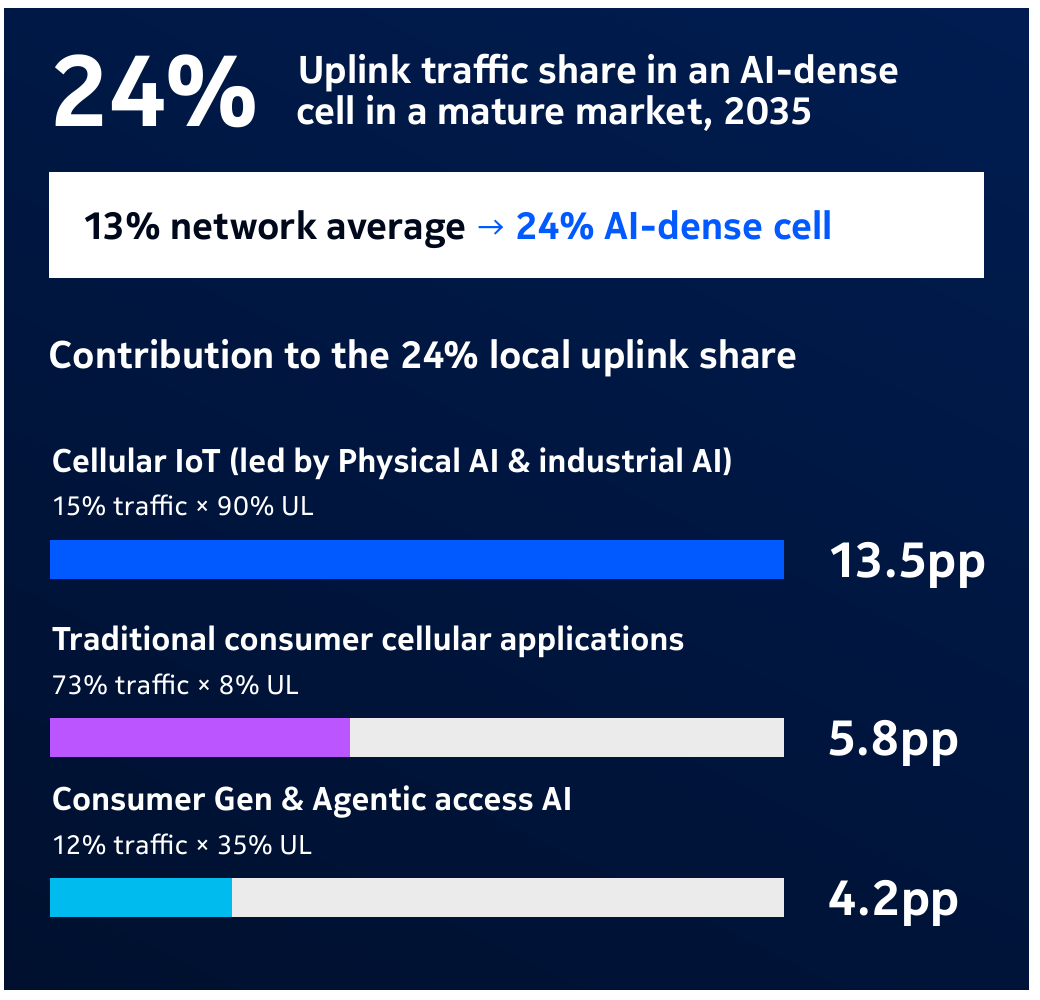
Network-wide, Nokia projects mature-market cellular uplink share rising only to about 13% (a 1:7 UL:DL ratio) by 2035. Traditional consumer apps run at 7–8% uplink; consumer GenAI and agentic access AI run at 25–40%; cellular IoT, increasingly physical AI, runs above 90%. The blended average barely moves because traditional consumer traffic is still the majority.
But AI-dense cells are not average cells. In Nokia’s mature-market dense-cell scenario, cellular IoT reaches 15% of traffic and consumer GenAI/agentic AI 12%, which pushes local uplink share to about 24%, a 1:3 ratio.
Source: Nokia Global Network Traffic Report 2026, p.28.
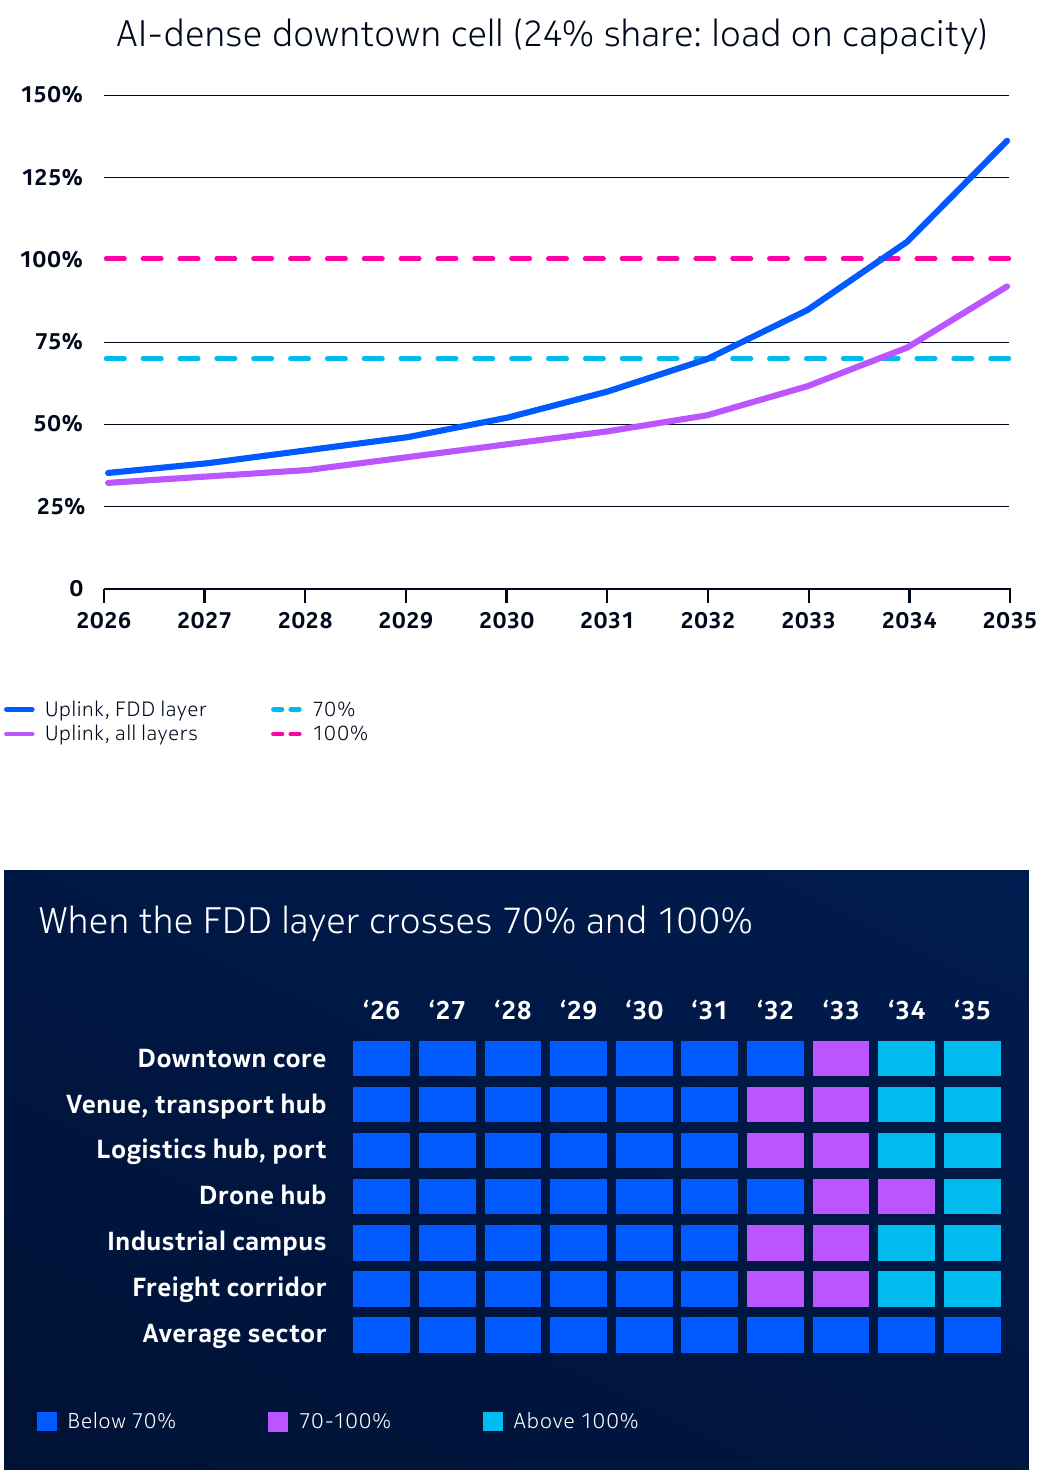
The capacity side is where it bites. Most newer spectrum is TDD, and typical TDD frame configurations allocate roughly a fifth of bandwidth to uplink. So the uplink share of capacity keeps falling even as the uplink share of traffic rises. Nokia’s model has the average sector at about 33% uplink load in 2035 (closer to 50% on the FDD layer), but AI-dense sectors reaching about 92% load, with the FDD layer crossing the 70% latency-and-jitter threshold around 2033 and hitting 100% by 2034. Venues, ports, drone hubs, industrial campuses and freight corridors breach between 2032 and 2033.
Source: Nokia Global Network Traffic Report 2026, p.29.
ACG’s take on the RAN economics:
This is a concentration problem, and concentration problems have different economics than growth problems. You do not solve a 2032 FDD crunch at a logistics hub by densifying a national network. You solve it with targeted spectrum refarming, uplink carrier aggregation and supplementary uplink, cell splitting at specific sites, and increasingly with private or neutral-host deployments at the industrial campus itself. The capex is lumpy and site-specific, which is good news for operators (it is addressable) and bad news for anyone hoping the uplink story drives a broad macro-RAN refresh on its own.
The FDD dependency is the real exposure. Nokia’s point that robotaxis, humanoid robots, drones and IoT modules “depend largely on FDD” is the most actionable sentence in the chapter. Low-band FDD is the coverage layer every IoT module falls back to, and it is the layer that fills first. Operators that have been quietly refarming FDD to 5G for consumer coverage should model industrial uplink demand before committing the remaining low-band holdings.
Who pays for uplink? Here the report is silent and the industry needs an answer. Consumer pricing is built on downlink buckets. A robotaxi uploading fleet telemetry for sixteen hours a day, or a camera array streaming to a cloud analytics platform, is a different cost-to-serve profile and should carry a different price. Operators that build uplink-aware enterprise pricing and SLAs before 2030 will capture value; those that treat it as undifferentiated IoT connectivity will subsidize it. This is a business-case problem first and an AI-RAN problem second.
Mitigation through on-device inference is the wildcard. Nokia’s forecast counts only traffic exchanged with the access network. Every camera that does its inference at the edge of the device and sends metadata instead of video pulls traffic out of this forecast. The uplink crunch timeline should be read as “if the industry keeps shipping cloud-analytics architectures.” Our view is that the economics of uplink congestion will themselves push inference toward the device, partially self-correcting the problem, but not before the 2032–2034 window at the locations Nokia names.
5. The AI grid: 36% at the edge and metro, and what that is actually worth
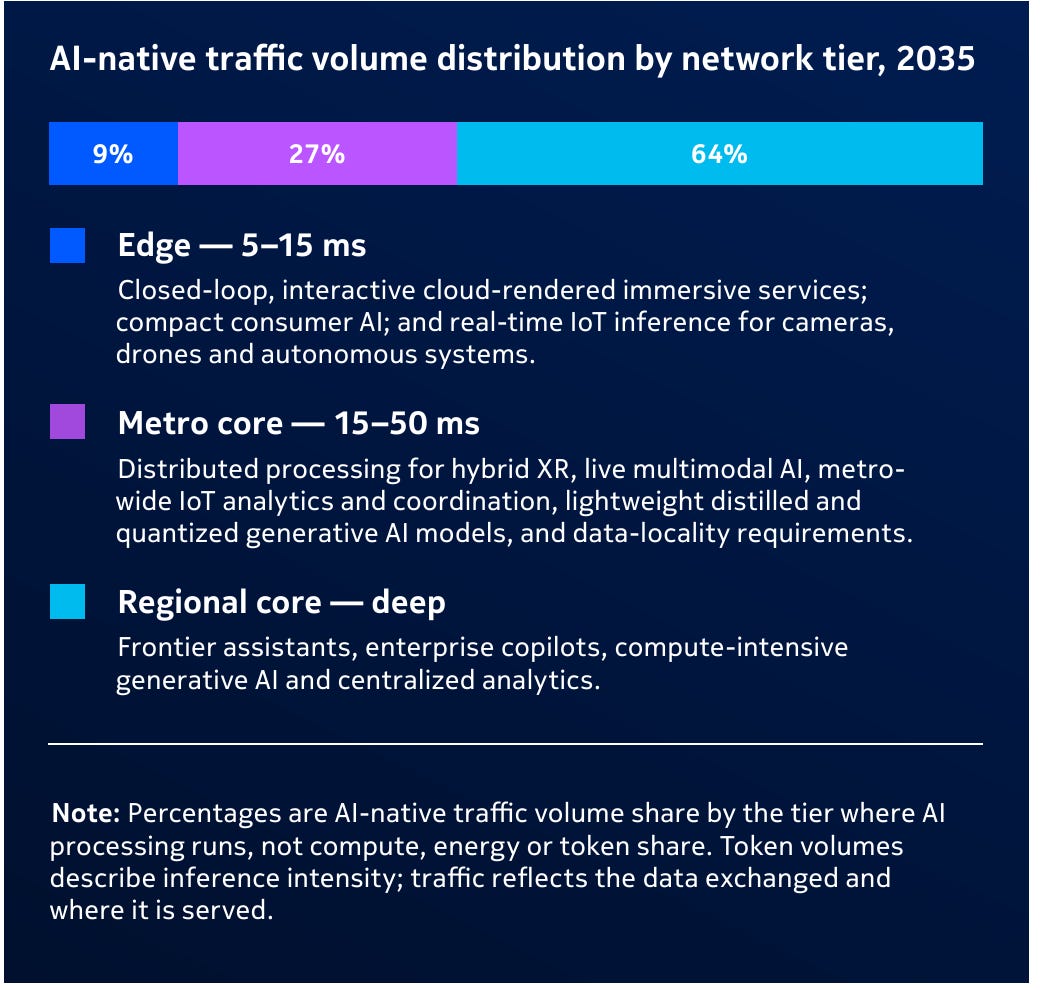
Nokia projects that by 2035 AI-native traffic will be served 9% at the edge (5–15 ms), 27% in the metro core (15–50 ms) and 64% in the regional core or central cloud.
Source: Nokia Global Network Traffic Report 2026, p.25.
Nokia is careful with the footnote, and so should readers be: these are shares of traffic volume by the tier where processing runs, not compute share, energy share or token share. A regional cloud running a frontier model may generate less network traffic per inference than a metro edge serving live video analytics. So “36% at the edge and metro” does not mean 36% of AI compute moves out of hyperscaler regions. It means 36% of AI-native bytes are exchanged with something closer than a regional cloud.
ACG’s view on the edge economics:
The metro core is the real battleground, not the far edge. The 9% edge tier is latency-driven and niche: closed-loop control, teleoperation, cloud-rendered XR. The 27% metro tier is where distilled and quantized models, metro-wide IoT analytics, hybrid XR and data-locality workloads live. That is a large, addressable layer, and it maps onto real estate that CSPs already own (metro central offices, metro DCs) and onto real estate hyperscalers are actively building (local zones, metro edge zones) and onto carrier-neutral colocation. Three parties, one tier. The winner is whoever can offer GPU capacity, sovereignty guarantees and low-latency interconnect at the lowest cost per inference, and operators have not historically won cost-per-unit contests against hyperscalers.
History is not on the CSP’s side, but the workload is different this time. Multi-access edge computing failed as a business a decade ago because there was no workload that needed it badly enough to pay for it. Inference with sovereignty and latency constraints is a more credible anchor tenant than anything MEC had. Our caution is that the credible anchor tenants (industrial video analytics, fleet coordination) are enterprise workloads with enterprise sales cycles, and the operator metro edge business case will be built one vertical at a time, not on consumer AI.
The routing consequence is east-west metro traffic. If 27% of AI-native traffic terminates in a metro tier that is itself distributed across operator DCs, hyperscaler zones and colos, the metro network stops being a hub-and-spoke backhaul network and becomes a mesh of DC-to-DC links with data-center-grade latency and loss requirements. That is a different metro architecture, and a different metro router feature set (segment routing, deterministic latency, telemetry, high-density 400/800GE) than the one most operators have deployed.
6. The access traffic baseline, briefly
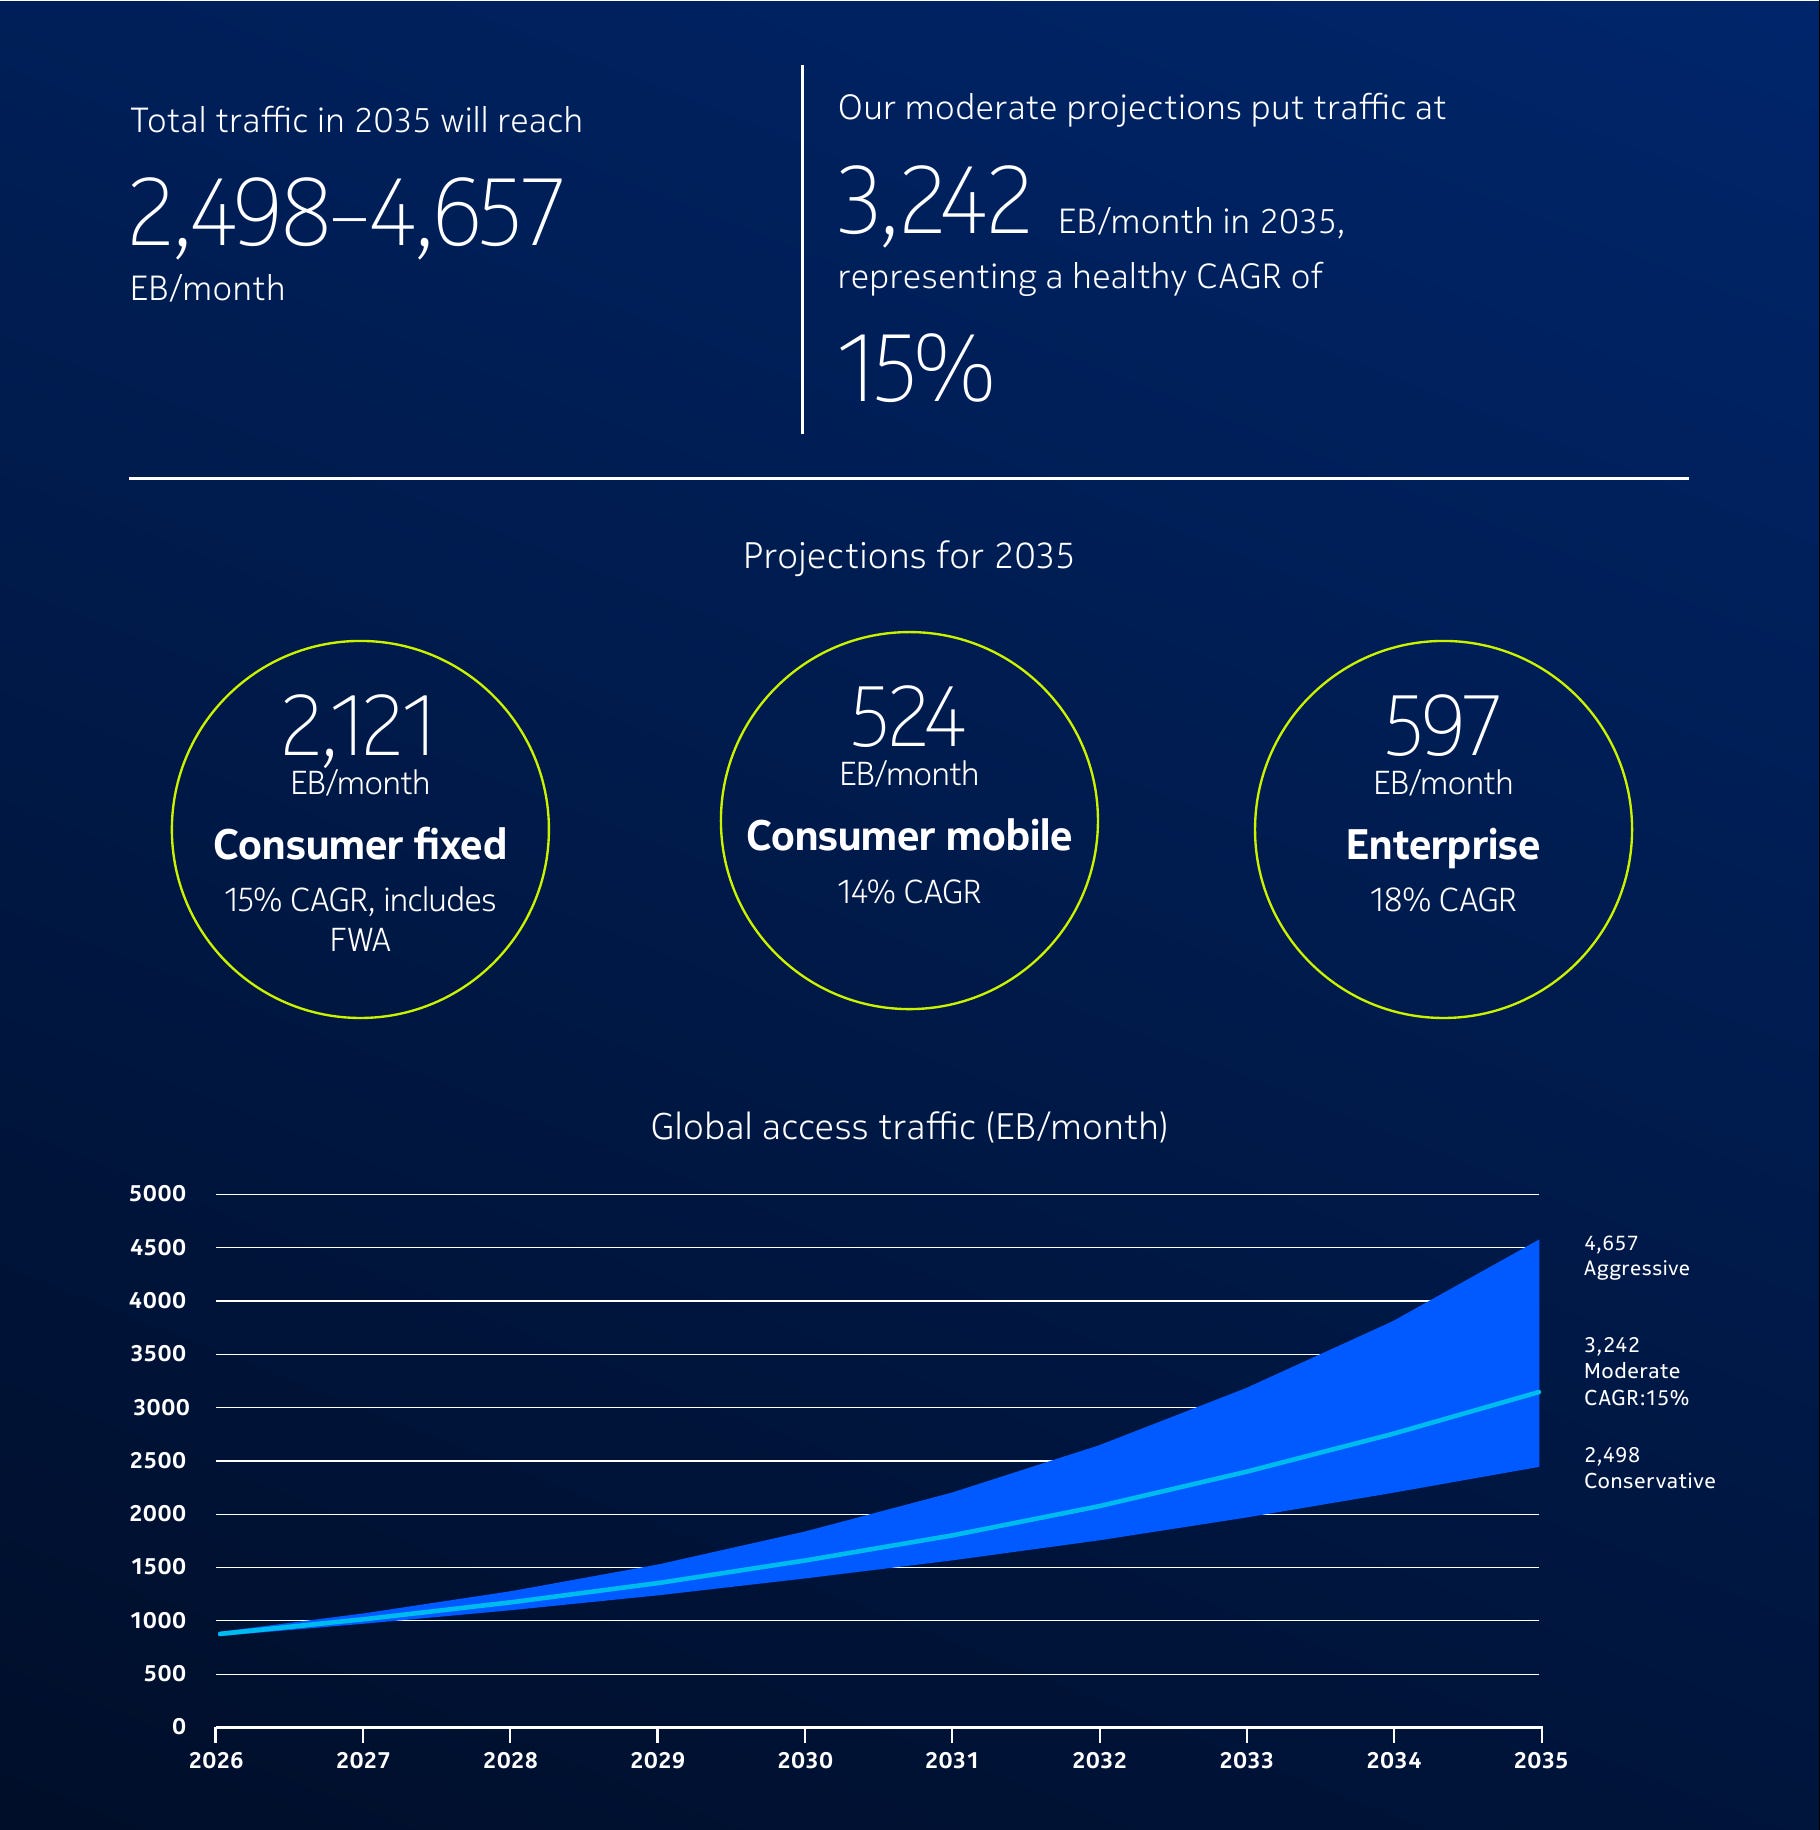
The non-AI half of the report is solid and unsurprising, which is a compliment. Global access traffic grows 3x to 5x by 2035, 2,498 to 4,657 EB/month, with 3,242 EB/month at 15% CAGR in the moderate case. Consumer fixed is 2,121 EB/month (15% CAGR, including FWA), consumer mobile 524 EB/month (14%), enterprise 597 EB/month (18%).
Source: Nokia Global Network Traffic Report 2026, p.32.
Three points worth lifting out:
FWA becomes a third of consumer cellular traffic. Nokia projects 304 EB/month of consumer FWA on top of 524 EB/month of mobile, with APAC generating over half of global FWA traffic and North America about 17%. “Cellular” and “mobile” stop being synonyms, and the cellular network becomes, in traffic terms, a home broadband network with a mobile overlay. That reshapes RAN dimensioning in the suburbs as surely as physical AI reshapes it at the port.
Enterprise industry overtakes enterprise office. Industrial access traffic grows at 27% CAGR to 329 EB/month versus office at 13% to 268 EB/month, with IoT and XR together reaching 55% of enterprise traffic and XR alone about a quarter of industrial traffic by 2035. A handful of device types (cameras, vehicles, robots, drones) drive the bulk of industrial volume; the billions of sensors and meters barely register.
India passes China in mobile data early next decade, and emerging regions (India, APAC, MEA) carry most of the absolute mobile growth on the back of 5G coverage and limited fixed alternatives. Developed markets grow through per-user intensity, which is where GenAI, agentic AI and XR show up first.
7. How wide is the funnel? Scenarios and a methodology sanity check
Nokia presents conservative, moderate and aggressive scenarios for access traffic. The spread tells you where the model is confident and where it is not.
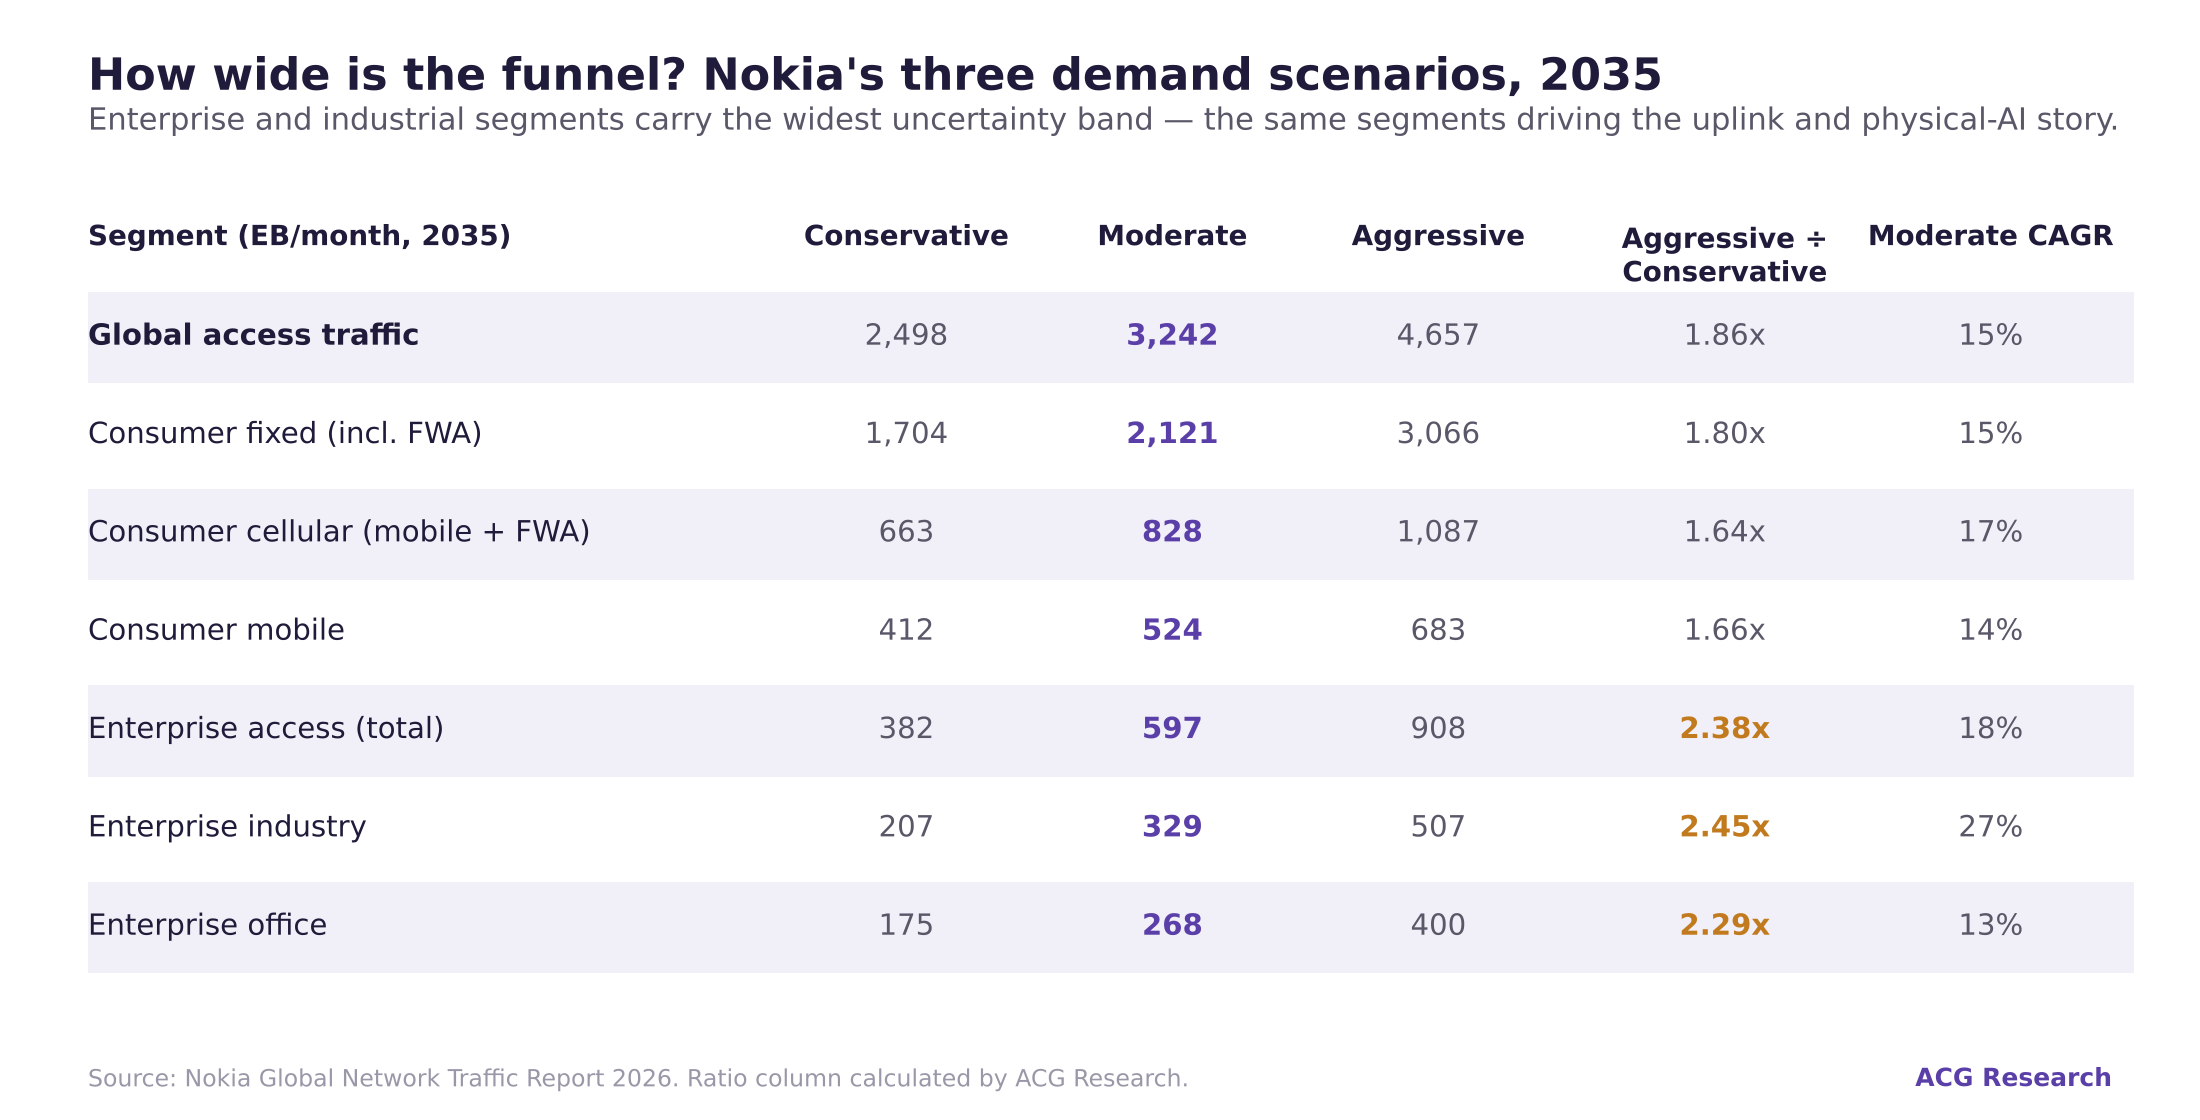
Consumer fixed and mobile sit within a 1.6x to 1.9x band between the low and high cases. Enterprise segments span 2.3x to 2.5x. The forecast is least certain in precisely the segments (industrial IoT, enterprise AI, XR) that drive the uplink and physical AI narrative. That is an honest result and the report deserves credit for publishing it.
Where ACG agrees with the report:
The scoping is disciplined. Excluding on-device and on-premise traffic, training dataset transfers, DC fabric traffic and inter-DC replication is the right call for a WAN forecast, and Nokia states it plainly. The two-lens structure (AI view and access view over the same total) avoids the double counting that plagues most AI traffic claims. The uplink/downlink profiles are measured, not assumed. And the link-by-link amplification model is the most useful planning artifact any vendor has published on AI traffic.
Where ACG would push back, or at least widen the error bars:
The 44% headline leans on a soft category. AI-influenced traffic is incremental video and commerce that AI recommendations caused. It is real, but it is not measurable in any network, and it is 41% of the “AI-driven” total. The cleaner claim is that AI-native traffic reaches 26% of global traffic by 2035. We would lead with that number.
There is no scenario range on the AI numbers. Nokia gives three scenarios for access traffic but a single point estimate for AI-native, agentic and cloud AI traffic, which are the categories growing at 58% to 76% CAGR and the ones most sensitive to assumptions. A 76% CAGR sustained for nine years is a 160x multiple; shave it to 60% and the multiple is 69x. The agentic forecast in particular depends on the number of orchestration cycles per task and the bytes per exchange, and both are moving targets. Token efficiency, prompt caching, on-device agents and protocol consolidation all push down; video-native and multimodal agents push up. Reasonable analysts could land anywhere from a third to double Nokia’s figure.
Physical AI installed-base assumptions are on the high side. 17.1 million humanoid robots in service by 2035 would be a remarkable outcome, and camera traffic assumes cloud analytics remains the dominant architecture for 1.7 billion cameras. Because the model is bottom-up from installed base times traffic per unit, these assumptions propagate directly into the 105x physical AI figure and into the AI-dense cell congestion timeline. Our expectation is that the direction is right and the timing slips two to three years as on-device inference takes share.
A vendor forecast is a vendor forecast. Nokia sells the routers, the RAN and the optics that this traffic would require, and the report’s conclusion that “advanced connectivity is central to AI delivery, not peripheral to it” is also its marketing message. That said, the access baseline (15% CAGR) is if anything conservative relative to the last decade of mobile growth, so the base case is not inflated. The uncertainty is concentrated in the AI overlay, where the incentives and the genuine unknowns point the same way. Treat the AI numbers as a well-constructed upper-middle case rather than a central estimate.
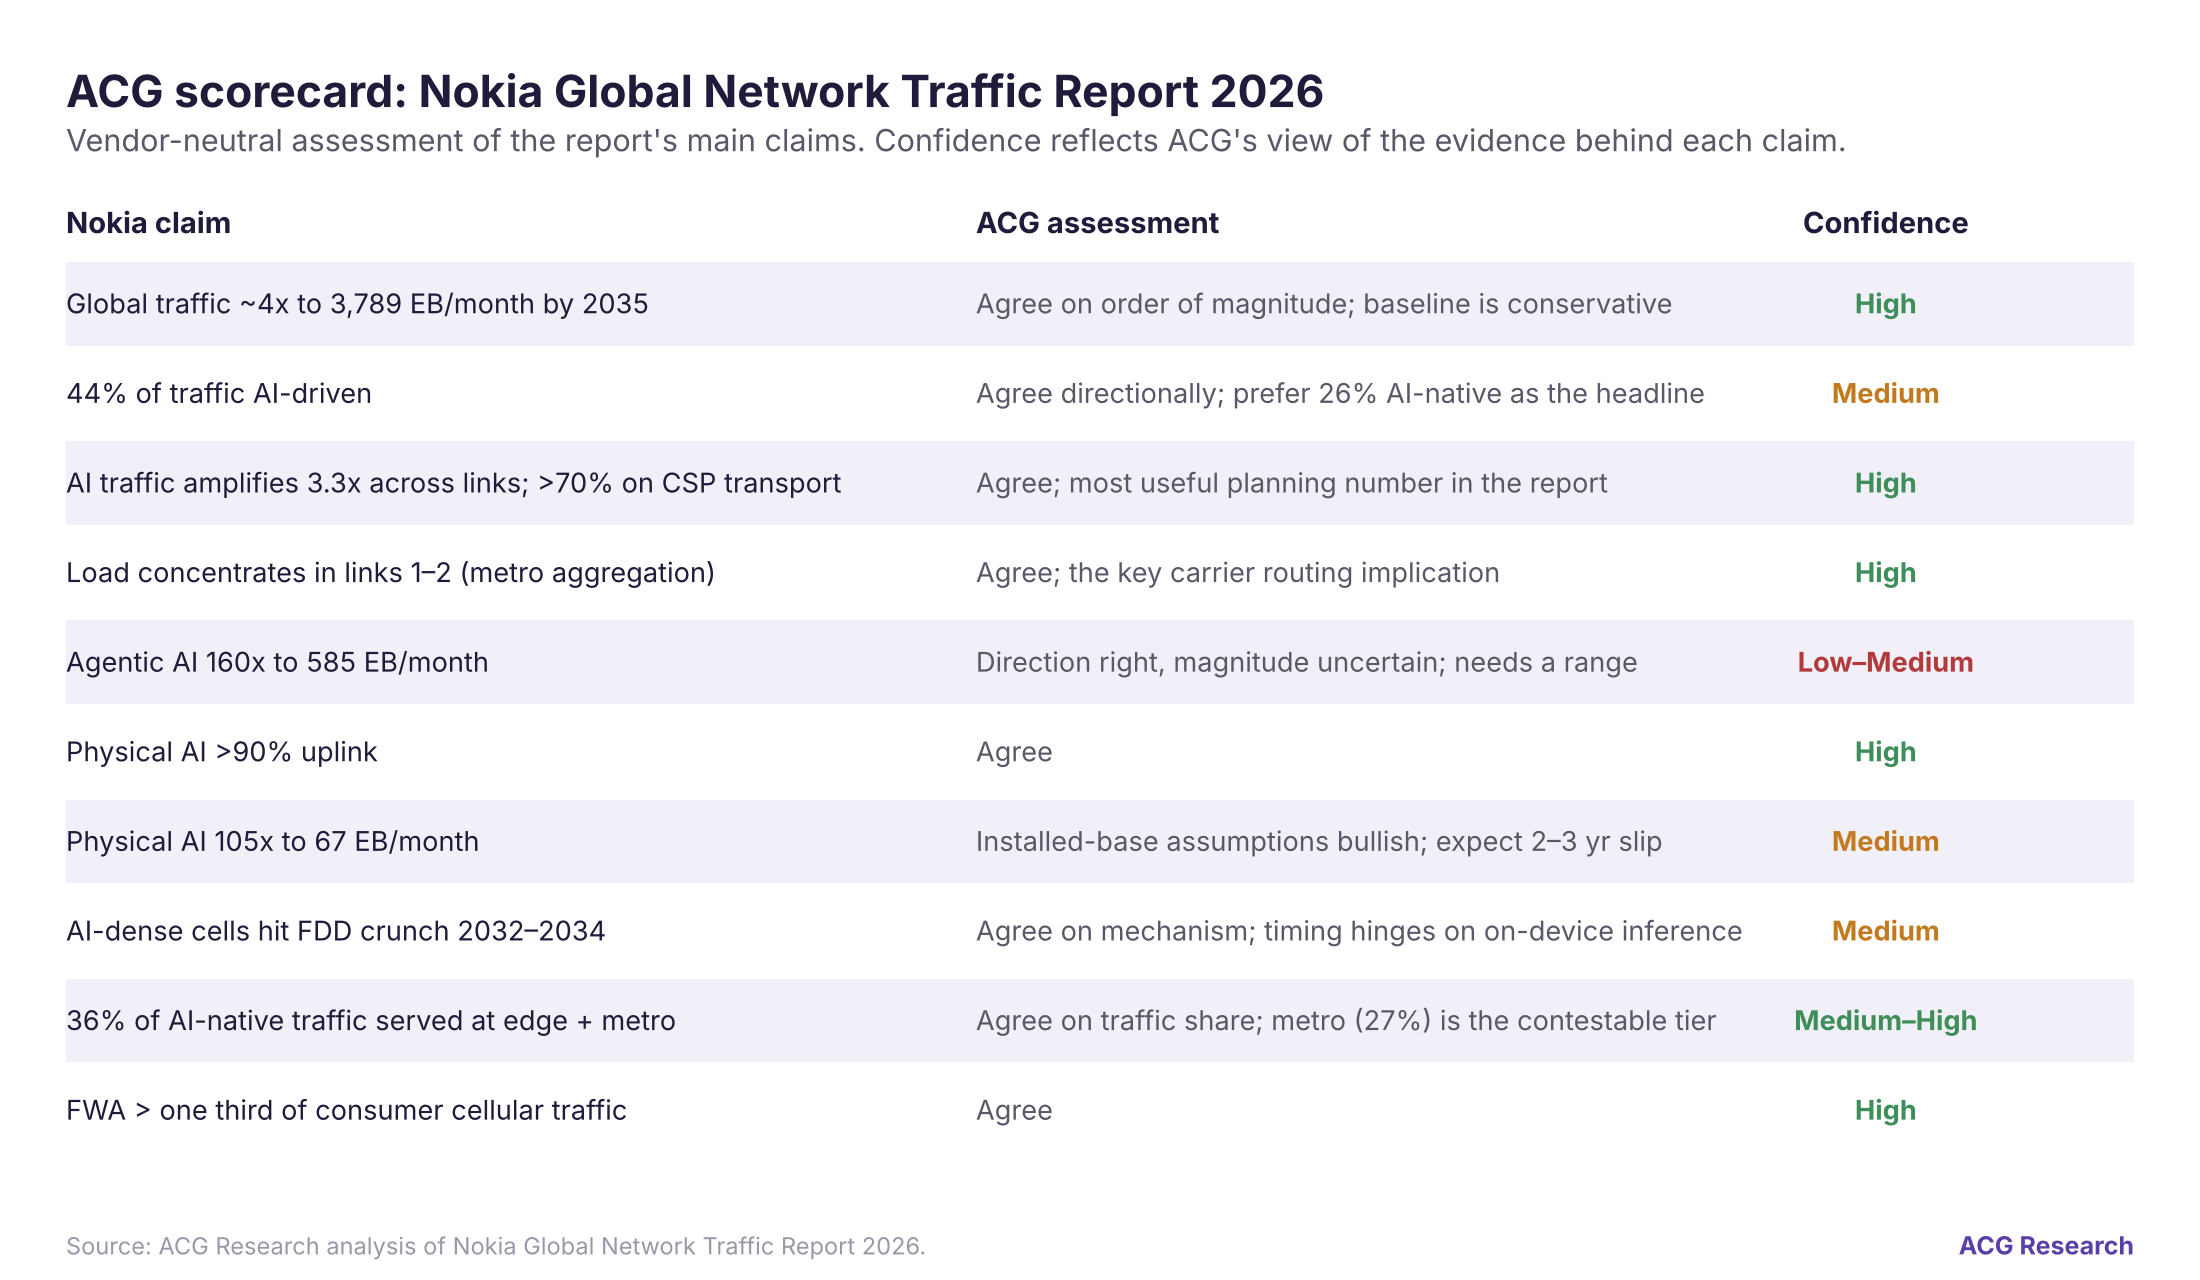
ACG scorecard
8. What to do with this
For operators. Stop planning metro aggregation as the thin layer. Model AI link traffic at links 1, 2 and 4 of Nokia’s architecture against your own topology and you will likely find the aggregation refresh needs to come forward, not the core. Inventory your low-band FDD commitments against industrial uplink demand at named locations (ports, logistics hubs, campuses, venues) before 2030. Build uplink-aware enterprise pricing now, while the robotaxi and camera-analytics contracts are still being written. And be selective about the metro edge: pick two or three verticals where sovereignty or latency genuinely forces inference into your footprint, rather than building speculative GPU capacity for consumer AI that will be served from a hyperscaler region.
For routing and optical vendors. The volume story for the CSP WAN is a metro story: dense 400/800GE aggregation, coherent pluggables in metro rings, and metro DC interconnect with data-center-grade characteristics. Products and roadmaps that treat aggregation as a cost-down tier will miss where the capacity is going. Port asymmetry awareness, burst-tolerant buffering and telemetry that can distinguish AI session types from video will become selection criteria. And keep this forecast separate from the DC fabric market; it does not size the back-end.
For hyperscalers and neoclouds. The 462 EB/month of cloud agentic traffic and the 815 EB/month on CSP-to-cloud peering links are your problem as much as the operator’s. On-ramp capacity, metro zone placement relative to operator aggregation sites, and the interconnect between your regions and the neocloud and content ecosystems (links 8, 9 and 12) all become constraints on agentic application performance. The AI grid is as much an interconnect strategy as a compute strategy.
For enterprises deploying physical AI. The report should change how you architect, not just how you connect. Every unit of inference you move onto the device or the campus removes traffic from a cellular uplink that Nokia says will be saturated at exactly your kind of site by 2033. Private 5G, neutral-host arrangements and edge analytics are not optional extras for a 2030-era industrial AI deployment; they are how you avoid competing with consumers for an FDD carrier.
The network industry spent the last two years arguing about whether AI would show up in WAN traffic at all, or whether it would stay locked inside data center fabrics. Nokia’s report is the most rigorous argument yet that it shows up, that it shows up in the metro before the core, that it shows up in the uplink before the downlink, and that most of it is traffic no human will ever see. Our quibbles are about magnitude and timing. On direction, the report is right, and the planning window it describes, 2030 to 2034, is closer than most capital plans assume.
Ray Mota, ACG Research. ACG publishes the Carrier Routing & Switching market share and forecast reports and economic analysis for the networking industry. Nokia charts are reproduced from the Nokia Global Network Traffic Report 2026 for commentary; ACG charts and calculations are our own.
Originally published on Ray Mota's Substack. Subscribe to get new analysis by email.